A newer version of this document is available. Customers should click here to go to the newest version.
Visible to Intel only — GUID: GUID-D6149870-9D46-496C-AB61-6A4214F261C0
Visible to Intel only — GUID: GUID-D6149870-9D46-496C-AB61-6A4214F261C0
Examine a SYCL Application Graph
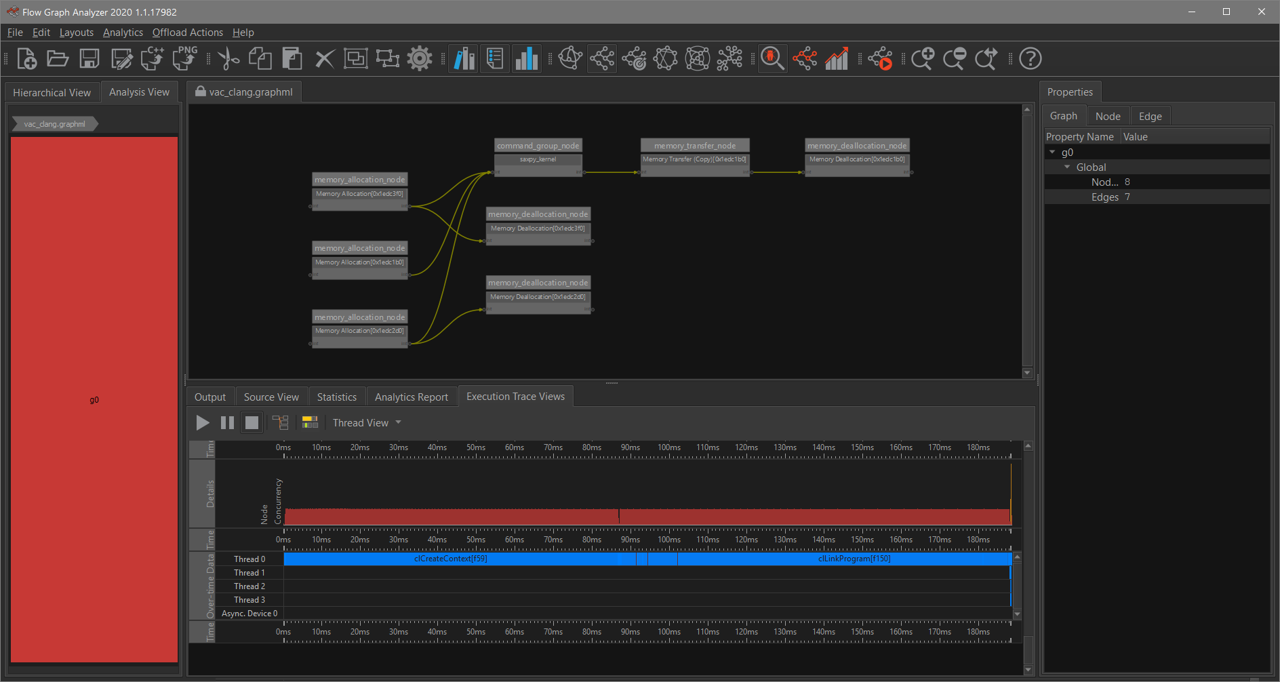
The visualization of SYCL applications is similar to data from other run-times, such as Intel® oneAPI Threading Building Blocks (oneTBB) or OpenMP*. The graph in SYCL represents the asynchronous task graph created from the end-user construct such as buffer accessors, command group handler, and data parallel constructs such as parallel_for.

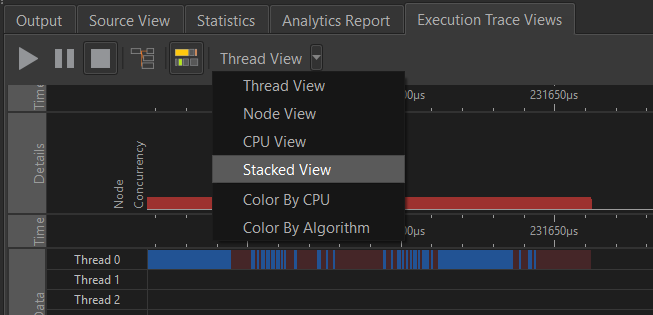
The data from the sample viewed in Flow Graph Analyzer is shown above. As with other runtimes, the graph view is correlated with the execution trace views. The workflows will provide similar information for SYCL. To better visualize the overlapping tasks in the execution trace view, select the Stacked View attribute from the pull-down menu as shown below:

This will change the view to an icicle chart that displays everything in detail, and you can see the calls to the OpenCL™ stack.

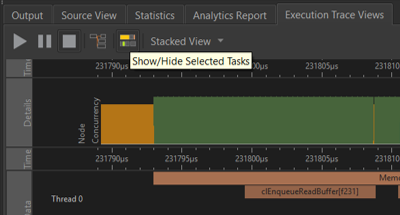
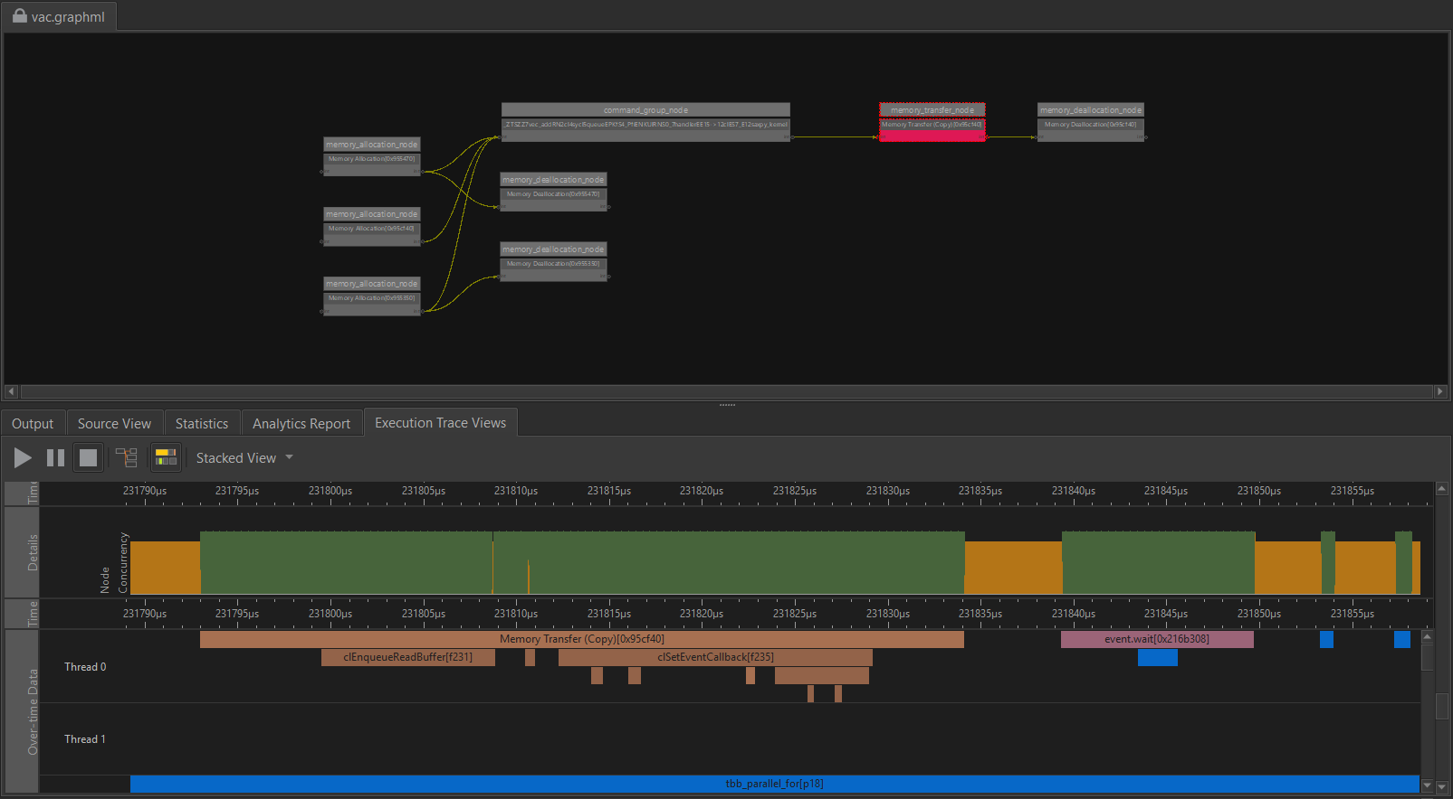
Clicking on a task in the timeline views will highlight a node in the graph if that task belongs to the graph. If you want to highlight all the tasks that belong to a graph node, you should enable task highlighting button and select a node on the graph to see the associations.

The screenshot below shows the tasks that belong to the memory_transfer_node are highlighted in a different color. Using the correlation features, one can debug the execution profile of the application to get a better understanding of the execution. Flow Graph Analyzer also includes features that target specific performance-related issues and the other sections go into detail for each one of these potential performance problems.
