A newer version of this document is available. Customers should click here to go to the newest version.
Analyze GPU Roofline
Measure and visualize the actual performance of GPU kernels using benchmarks and hardware metric profiling against hardware-imposed performance ceilings, as well as determine the main limiting factor, by running the GPU Roofline Insights perspective.
Use the Roofline chart to answer the following questions:
What is the maximum achievable performance with your current hardware resources?
Does your application work optimally on current hardware resources?
If not, what are the best candidates for optimization?
Is memory bandwidth or compute capacity limiting performance for each optimization candidate?
Run the GPU Roofline Insights to measure performance of SYCL, C++/Fortran with OpenMP* pragmas, Intel® oneAPI Level Zero (Level Zero), or OpenCL™ applications enabled to run on a GPU.
How It Works
The GPU Roofline Insights perspective includes the following steps:
- Collect OpenCL™ kernels timings and memory data using the Survey analysis with GPU profiling.
- Measure the hardware limitations and collect floating-point and integer operations data using the Characterization analysis with GPU profiling.
Intel® Advisor calculates compute operations (FLOP and INTOP) as a weighted sum of the following groups of instructions: BASIC COMPUTE, FMA, BIT, DIV, POW, MATH.
Intel Advisor automatically determines data type in the collected operations using the dst register.
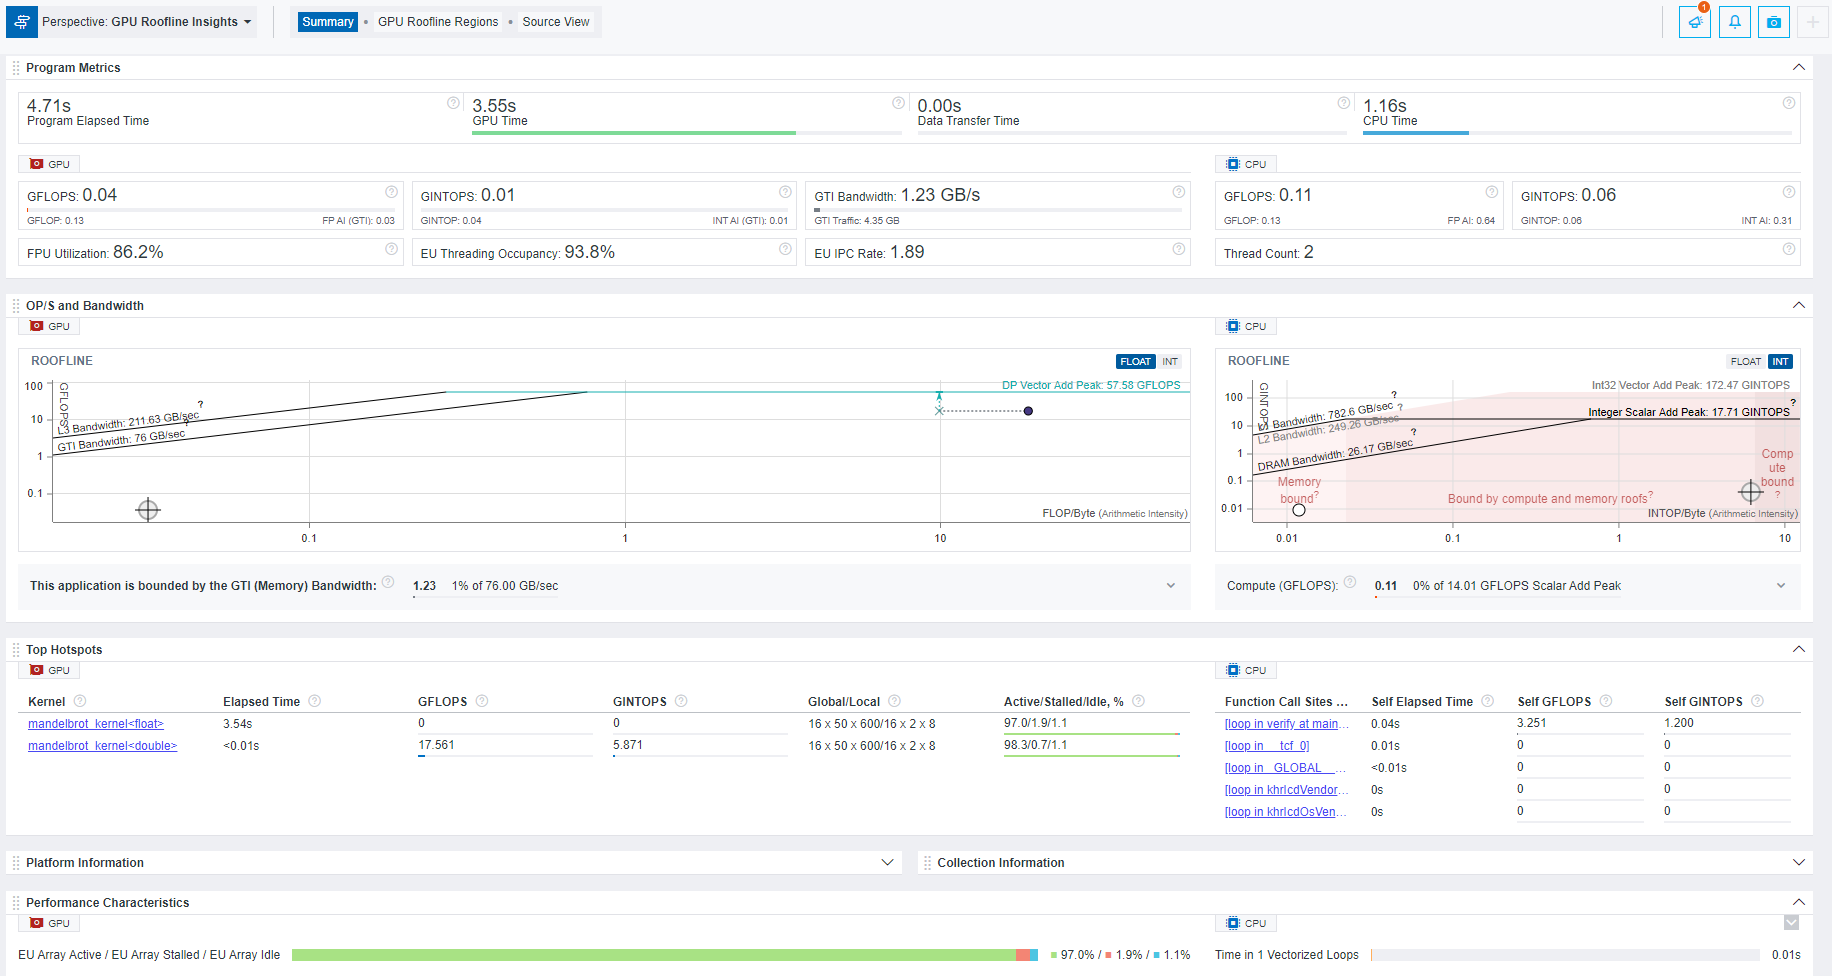
GPU Roofline Summary
GPU Roofline Insights perspective measures performance of kernels executed on GPU and loops/functions executed on CPU and shows what you should optimize your application for. Examine the following performance data:
See application execution time on GPU and CPU, time spent to transfer data between the CPU and GPU, and how well your application uses the GPU resources.
Review the Roofline charts for CPU and GPU parts of your application.
View the execution time details and various performance metrics on GPU- and CPU-executed parts of your application.
View top five time-consuming loops on GPU and on CPU sorted by self time with performance metrics. You are recommended to start with these loops when checking for performance issues.

See the Summary section to examine the performance summary of your application, and continue to GPU Roofline Insights Regions tab to examine the performance in more detail.