Profiling Large Language Models on Intel® Core™ Ultra 200V (NEW)
This recipe demonstrates how you use Intel® VTune™ Profiler to analyze Large Language Models (LLMs) and improve the performance of AI applications. This recipe uses an LLM deployed on the Intel® Distribution of OpenVINO™ toolkit.
Large Language Models (LLMs) are the fundamental building blocks and base components of Generative AI (GenAI) applications. However, profiling LLMs for performance issues contains inherent challenges. You may encounter significant issues when you examine such aspects as:
- Model compile time
- First token time
- Average token time
- Resource utilization
- Model optimization
- Hardware utilization
- Efficient deployment of the LLM
This recipe demonstrates you analyze an LLM and improve the performance of an AI application that runs on the Intel AI PC Core™ Ultra 200V architecture. The LLM is deployed on the Intel® Distribution of OpenVINO™ Toolkit.
Content Expert: Yu Zhang, Xiake Sun
DIRECTIONS:
Set up your environment.
Run the GPU Offload Analysis.
Run the GPU Compute/Media Hotspots Analysis.
Examine AI profiling scenarios.
Ingredients
Here are the hardware and software tools you need for this recipe.
Application: The phi-3 LLM application
Inference Engine: Intel® Distribution of OpenVINO™ Toolkit version 2024.3(direct download)
Analysis Tool: VTune Profiler (version 2025.0 or newer)
Platform: Intel® Core™ Ultra 5 238V 2.10GHz
Operating System: Microsoft Windows*
Set Up Your Environment
To set up your environment,
- Build the OpenVINO source.
- Build and run the LLM application.
- Get the OpenVINO source from the repository:
git clone https://github.com/openvinotoolkit/openvino.git
cd openvino
git submodule update --init --recursive
- Build the source. Make sure to enable profiling for Instrumentation and Tracing Technology (ITT):
mkdir build && cd build
cmake -G "Visual Studio 17 2022" -DENABLE_PYTHON=OFF -DCMAKE_BUILD_TYPE=Release
-DENABLE_PROFILING_ITT=ON -DCMAKE_INSTALL_PREFIX=ov_install ..
cmake –build . --config Release --verbose –j8
cmake --install .
You can find more information about this setup in Build OpenVINO™ Runtime for Windows systems.
- Get the source of the application in the repository:
git clone https://github.com/sammysun0711/openvino.genai -b vtune_cookbook
- Build the application:
# ov_install_path refers to the ov_install path above
set OpenVINO_DIR= ov_install_path\runtime\cmake
mkdir build && cd build
cmake -DCMAKE_BUILD_TYPE=Release ..
cmake --build . --config Release --verbose -j8
- Prepare the OpenVINO model:
pip install optimum[openvino]==1.20.0 openvino==2024.3 --extra-index-url https://download.pytorch.org/whl/cpu

optimum-cli export openvino --task text-generation-with-past --trust-remote-code --model microsoft/Phi-3-mini-4k-instruct --weight-format int4 --sym --group-size 128 --ratio 1 phi-3-mini-4k-instruct
The converted OpenVINO Phi-3 and Tokenizer/Detokenizer models get saved in the phi-3-mini-4k-instruct directory. - Run the application:
# The dependencies of the application are all located in ov_install_path
set OPENVINO_LIB_PATHS= ov_install_path\bin\intel64\Release;
ov_install_path\runtime\3rdparty\tbb\bin
ov_install_path\setupvars.bat
openvino.genai\build\llm\phi_cpp\Release\phi.exe -m openvino.genai\phi-3-mini-4k-instruct\openvino_model.xml -token openvino.genai\phi-3-mini-4k-instruct\openvino_tokenizer.xml -detoken openvino.genai\phi-3-mini-4k-instruct\openvino_detokenizer.xml -d GPU --output_fixed_len 256 --force_max_generation
Run the GPU Offload Analysis
Once you set up your environment, run the GPU Offload analysis in VTune Profiler. This analysis type is useful when you want to:
- Explore code execution on the CPU and GPU
- Correlate activity between the CPU and GPU
- Identify performance bottlenecks
- Make sure that you have installed VTune Profiler properly. Use the self-check script in the installation directory.
- Check the GPU driver and runtime. Make sure that they are set up to profile GPUs.
- Make sure that you have loaded the sampling drivers.
To run the GPU Offload analysis,
- From the Analysis Tree in VTune Profiler, open the GPU Offload analysis type.
- In the WHAT pane, select Launch Application.
- Specify the path to the LLM application. Include any parameters that may be necessary.
- Select the Start button to run the analysis.
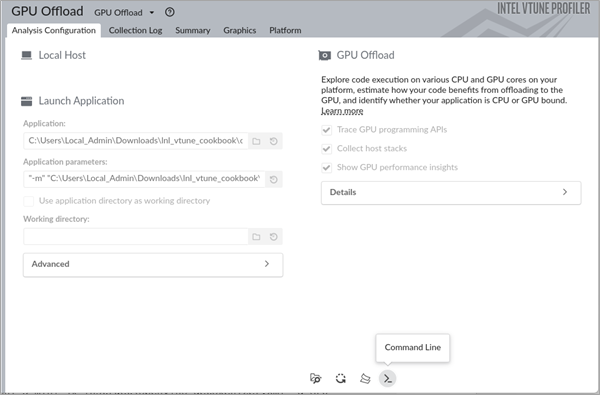
To run this analysis from the command line, select the Command Line option in the GUI. Copy and run the command in a terminal window.
Once the analysis is complete, results display in the Summary window. Go through these results and then switch to the Graphics window.
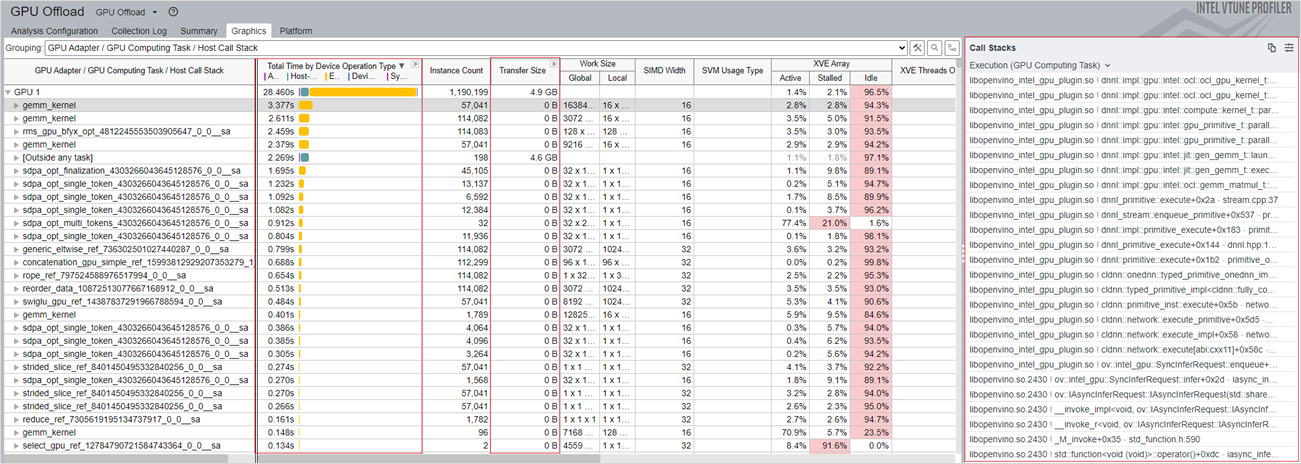
In the Graphics window, look for these details:
- In the Total Time by Device Operation Type column, see the total time that was spent on each computation task for the various types of operations. This information can help you identify the operation (allocation, transfer, execution, or sync) per kernel that spent the most time on the CPU or GPU. For a better understanding of the behavior of the hottest kernel, you can run the GPU Compute/Media Hotspots analysis, which is described later in this recipe.
- The Transfer Size column shows the size of data transfer per kernel between the CPU host and GPU device.
Now, switch to the Platform window.
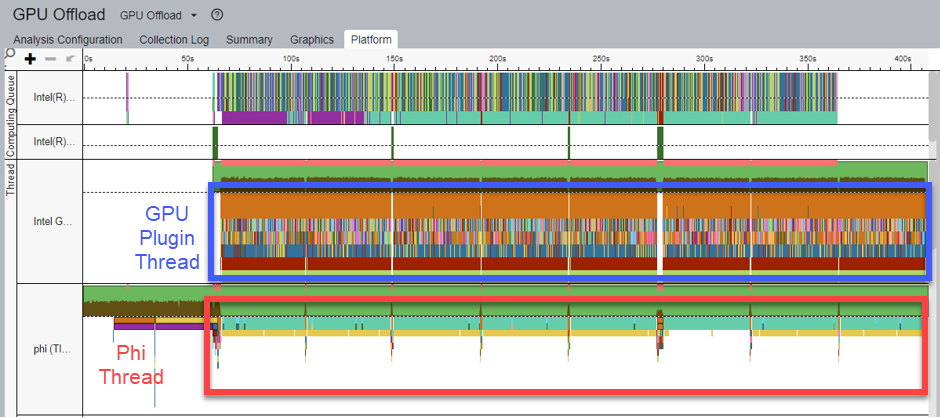
Here, in the Thread View, you see the following details:
- The Tokenizer/Detokenizer models are deployed on the CPU. The Phi-3 model is deployed on the GPU.
- In the figure above, the GPU Plugin Thread (highlighted in blue) shows all the operations that run on the CPU and GPU.
- There are eight paragraphs of text available as input for the Tokenizer model. As a result, when ITT is enabled, eight inference tasks for the Tokenizer model display in the phi thread.
- In the same figure, inference tasks for the Tokenizer model display in the Phi Thread (highlighted in red).
- Accordingly, a series of inference results of the Detokenizer follows the sentence inference of the Tokenizer.
- Corresponding to the phi thread, the phi-3 model inference tasks are executed in the GPU plugin thread.
To understand the use of GPU resource, correlate computing queues and kernels with information about GPU resources on the timeline.
For example, look at the kernels waiting in queue as well as kernel execution time. In parallel, look at the corresponding GPU metrics:
- gemm_kernel Correlation with Vector Engine
- GPU Memory Access
- CPU Time
- GPU Frequency
These metrics display in the lower section of the figure below:
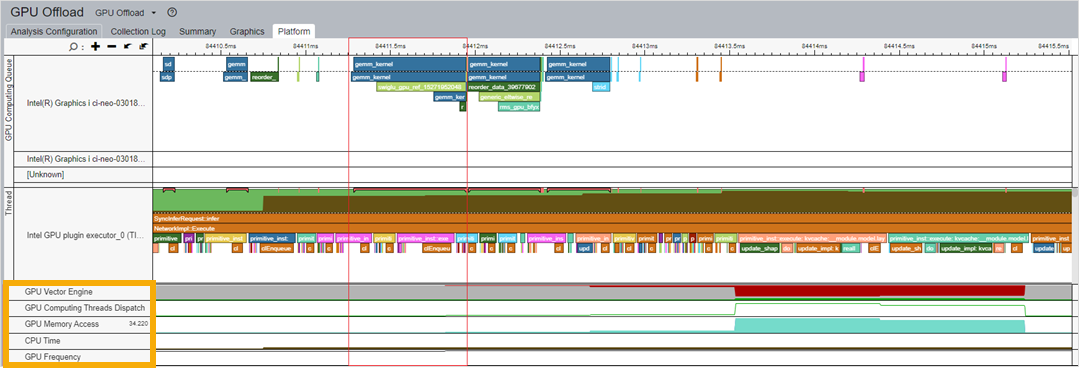
When you use this correlation to identify the kernel that consumes the most GPU resources, you can then run the GPU Compute/Media Hotspots Analysis to learn about the causes behind execution stalls and low occupancy.
Run the GPU Compute/Media Hotspots Analysis
- From the Analysis Tree in VTune Profiler, open the GPU Compute/Media Hotspots analysis type.
- In the WHAT pane, select Launch Application.
- Specify the path to the LLM application. Include any parameters that may be necessary.
- Select the Start button to run the analysis.
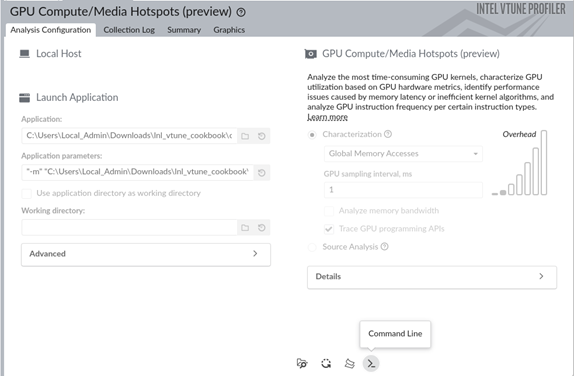
To run this analysis from the command line, select the Command Line option in the GUI. Copy and run the command in a terminal window.
Once the analysis is complete, results display in the Summary window.
Start reviewing results in the Bandwidth Utilization Histogram. This histogram plots the specific bandwidth at the memory level (in this example, GPU Memory and SLM) against time.
Learn about the use of GPU memory over time from the GPU Memory Read Bandwidth and GPU Memory Write Bandwidth metrics. When utilization is high, consider using shared local memory and cache reuse. These options can help reduce GPU memory access.


Learn about the use of shared local memory (SLM) over time from the Shared Local Memory Read Bandwidth and Shared Local Memory Write Bandwidth metrics. You can expect better performance gains when you use more SLMs.


Next, look at information in the Graphics Window.
In this window, relevant information displays in two tabs:
- Memory Hierarchy Diagram
- Platform
Memory Hierarchy Diagram:
In this diagram, you see GPU hardware metrics that were mapped for a kernel selected in the table below the diagram. The Memory Hierarchy Diagram updates dynamically to reflect the metrics of the current selection in the table.
VTune Profiler traces the GPU kernel execution and annotates each kernel with GPU metrics. This information displays in the table below the diagram. Select a kernel to see the memory access per hierarchy. You may find this information useful to analyze memory-bound performance issues. Cache reuse and SLM usage can reduce the memory access latency.
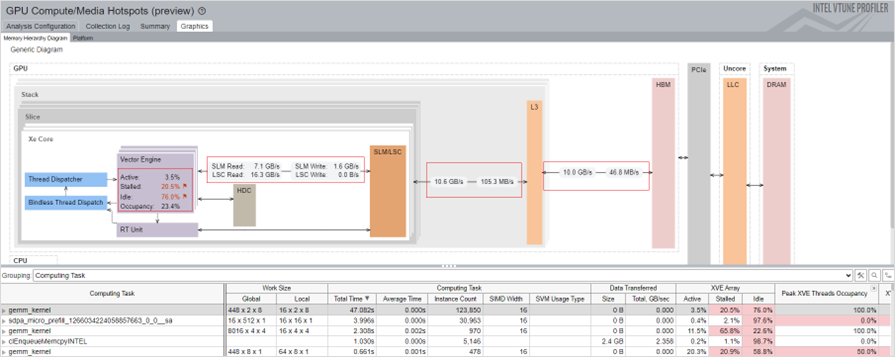
To profile compute-bound issues, group the results by Computing Task.
Platform:
The Platform tab displays the trends of these metrics over time:
GPU Vector Engine
GPU Computing Thread Dispatch
GPU Memory Access
GPU L3 Cache Bandwidth and Misses
GPU Shared Local Memory Access
GPU Load Store Cache Access
GPU Frequency
Use the information from these metrics to identify anomalies and potentials for optimization. You can zoom in to see the area you are interested in. For example, the first token inference (highlighted in the picture below) corresponds to the associated GPU hardware resources.
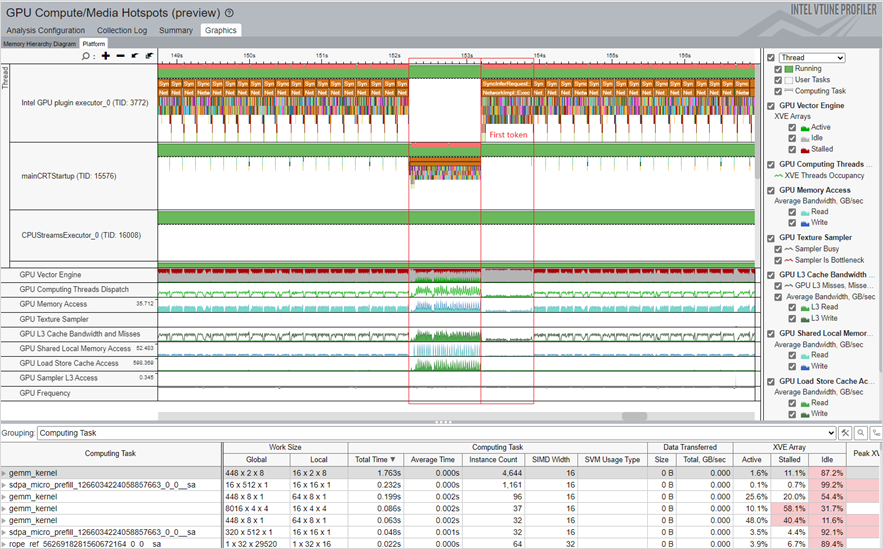
Each column in this table represents the GPU metrics associated with the selected kernel. All the kernels are sorted by the total time spent on a task.
From the metrics, you can infer these performance considerations:
- The GPU Vector Engine and Computing Thread Dispatch metrics indicate if the GPU is busy.
- The GPUMemory Access metric can help you identify issues related to limited memory bandwidth as well as latency issues. Model optimization and quantization can reduce multi-level memory access limited bandwidth.
- The L3 Cache Bandwidth and Misses metric exposes the reuse of L3 cache reuse.
- The Shared Local Memory Access metric indicates higher bandwidth and much lower latency for data access. Using SLM can reduce the memory access latency.
- The fluctuation of the GPU Frequency metric throughout the profiling period can impact the performance of your application.
When you group results by Computing Task, each column in the table represents the GPU metrics associated with the selected kernel. All the kernels are sorted by the total time that was spent on a task.

In the XVE Array column, the Idle section indicates that cycles without threads were scheduled on the XVE. High values here indicate that the GPU was relatively free. That is, the host did not have enough tasks to offload to the GPU. The Stalled section indicates that some GPU time was lost due to memory access latency or limited memory bandwidth. The Memory Hierarchy Diagram can shed more light on memory access information.
XVE Threads Occupancy is decided by Work Size and SIMD Size. If you want to increase the occupancy and thereby improve GPU utilization, learn how to fine-tune the work size and SIMD width.
Examine AI Profiling Scenarios
The following scenarios on profiling AI applications use OpenVINO workloads. For these workloads, VTune Profiler uses the Instrumentation and Tracing Technology API (ITT API) to analyze the time spent on tasks. Results display on a timeline. Although the time represented on the timeline exceeds the actual time consumed by the task due to ITT overhead, this information is a good reference and remains relevant for performance analysis.
Four scenarios get discussed here:
- Case 1: Model Compilation Optimization
- Case 2: Performance Optimization with Scaled Dot-Product Attention (SDPA) Subgraph Optimization
- Case 3: Reducing Last MatMul Computation and Memory Usage for Logits
- Case 4: Stateful Model Optimization for KV-Cache in LLM
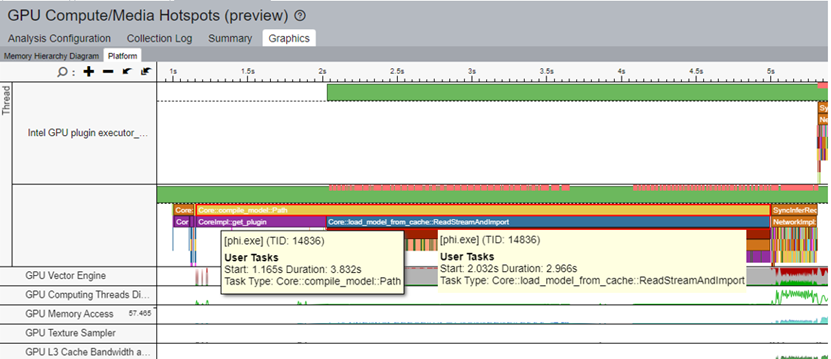
In a typical workflow, a model gets compiled for every inference. For example, in the figure of the timeline in the Hotspots view below, the task of Core::compile_model::Path takes 7s to complete. In this task, Plugin::compile_model takes about 6s.
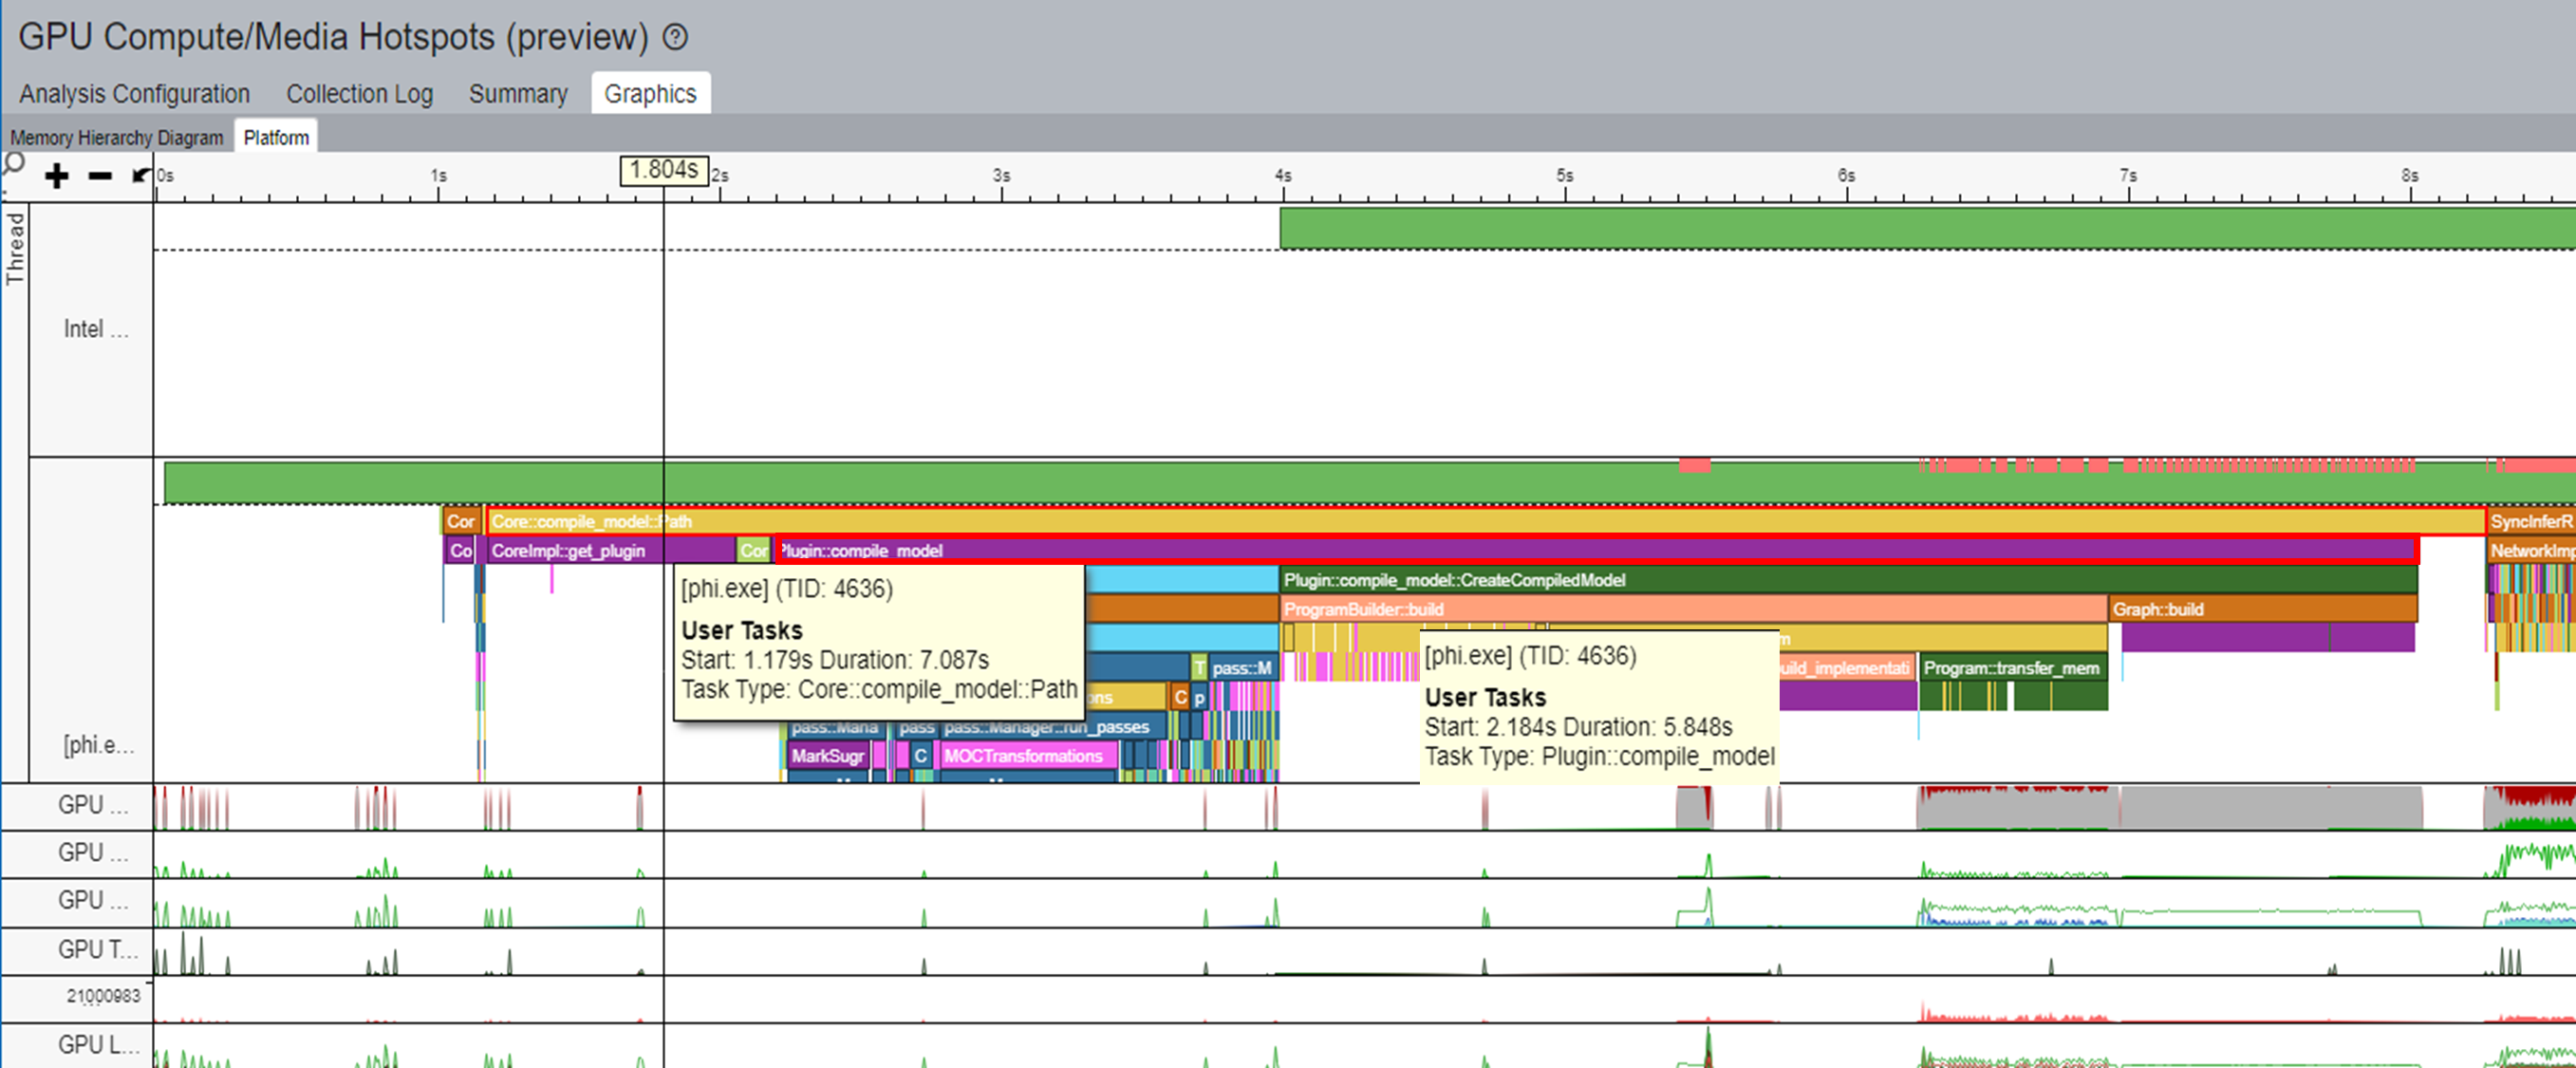
OpenVINO includes a model cache feature that you can use to accelerate model compilation:
ov::Core core;
core.set_property(ov::cache_dir("/path/to/cache/dir"));
auto compiled = core.compile_model(modelPath, device, config);
You can learn more about model cache in the OpenVINO™ Model Caching Overview.
You can reduce the compile time of the model by caching the model during its first run and then loading the model from the cache per inference. Applying this technique to the sample workload reduced the task time for Core::compile_model::Path to 4s. In turn, the task time for Core::load_model_from_cache was 3s. With this optimization, the model compilation performance improved by 40%.
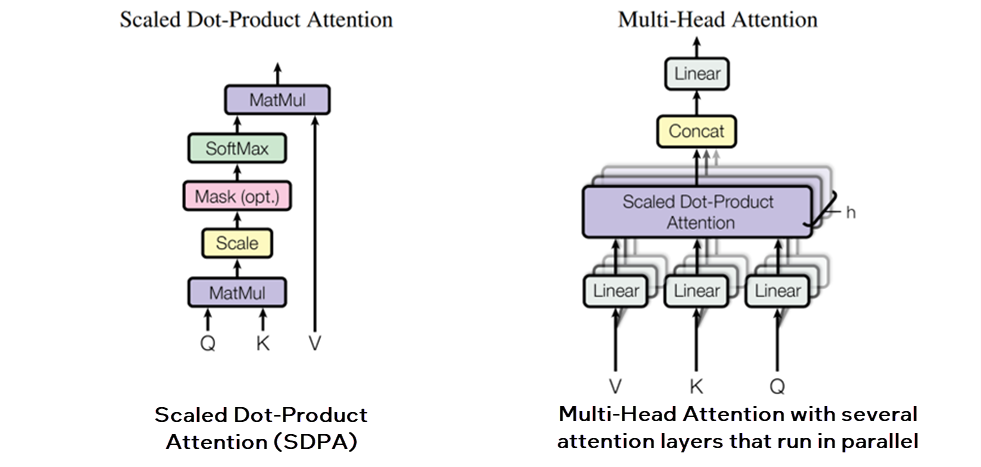
The Transformer network architecture introduces the Scaled Dot-Product Attention (SDPA) attention mechanism.
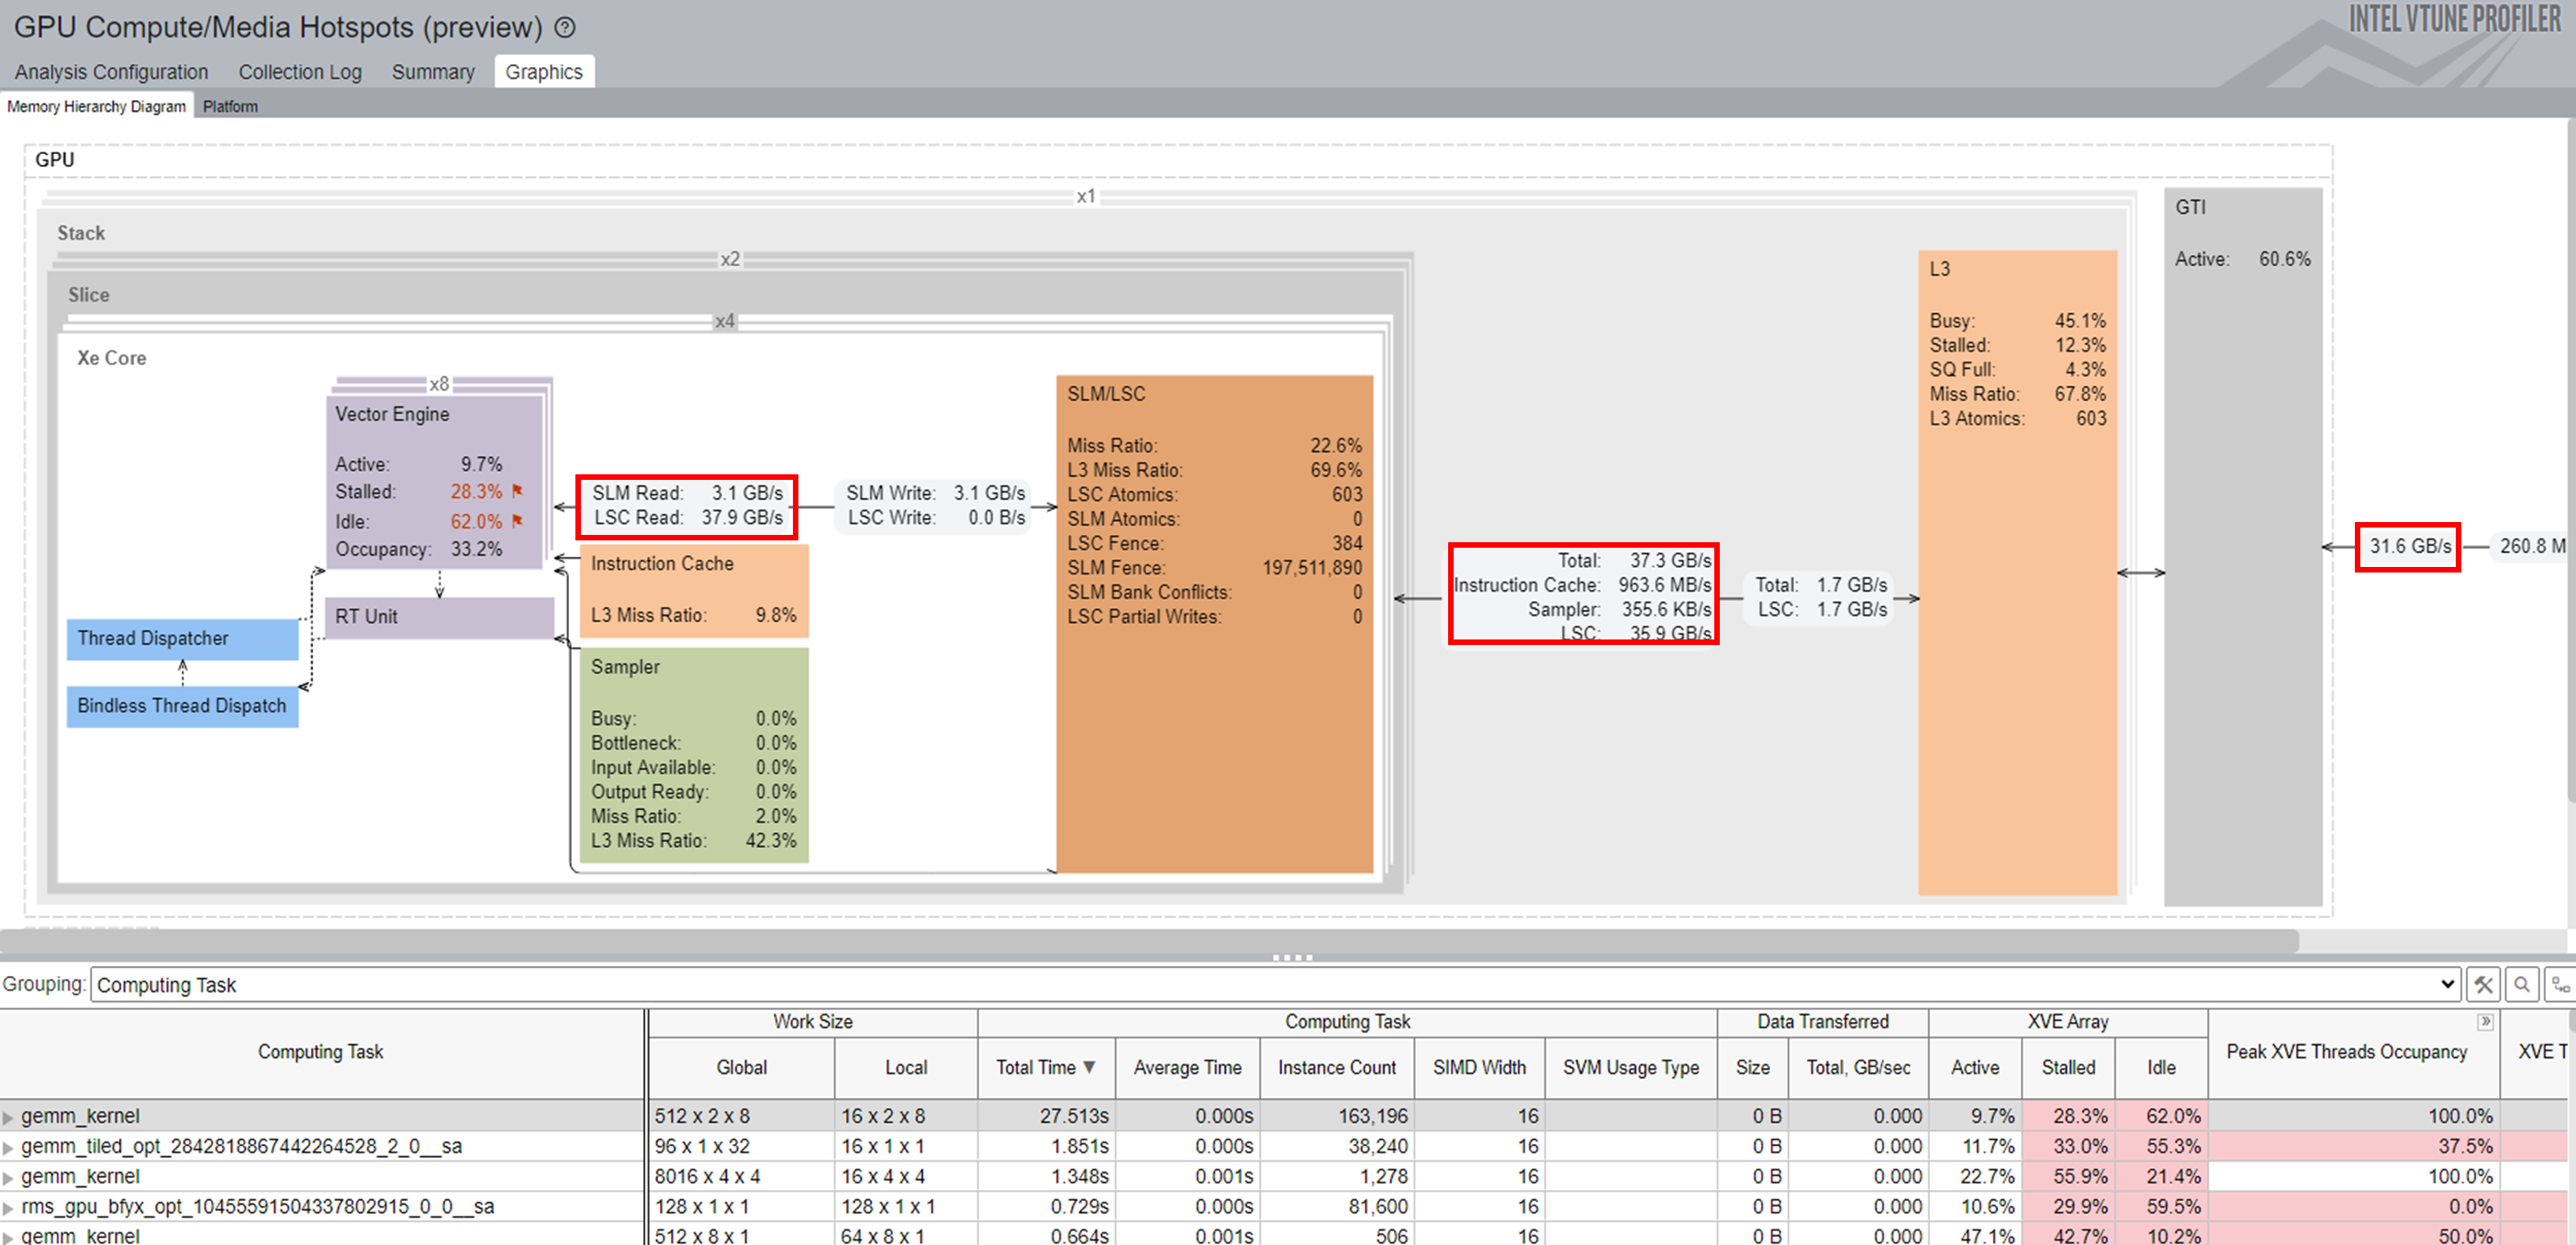
Memory Usage when SDPA Subgraph Fusion is Disabled:
OpenVINO provides a ScaledDotProductAttention operator for SDPA subgraph fusion. You can use this operator to mitigate memory-bound problems and also improve parallelism and memory access patterns in Multi-Head Attention (MHA). Taking these steps can reduce memory footprint and improve application performance. Use VTune Profiler to observe memory usage during the inference, especially for the hottest computing tasks.
Memory Usage when SDPA Subgraph Fusion is Enabled:
For the hottest computing task, gemm_kernel, you can observe the memory footprint between various memory levels (SLM, L3, and GTI) throughout the entire inference. The bandwidth improves significantly when you enable SDPA Subgraph Fusion.
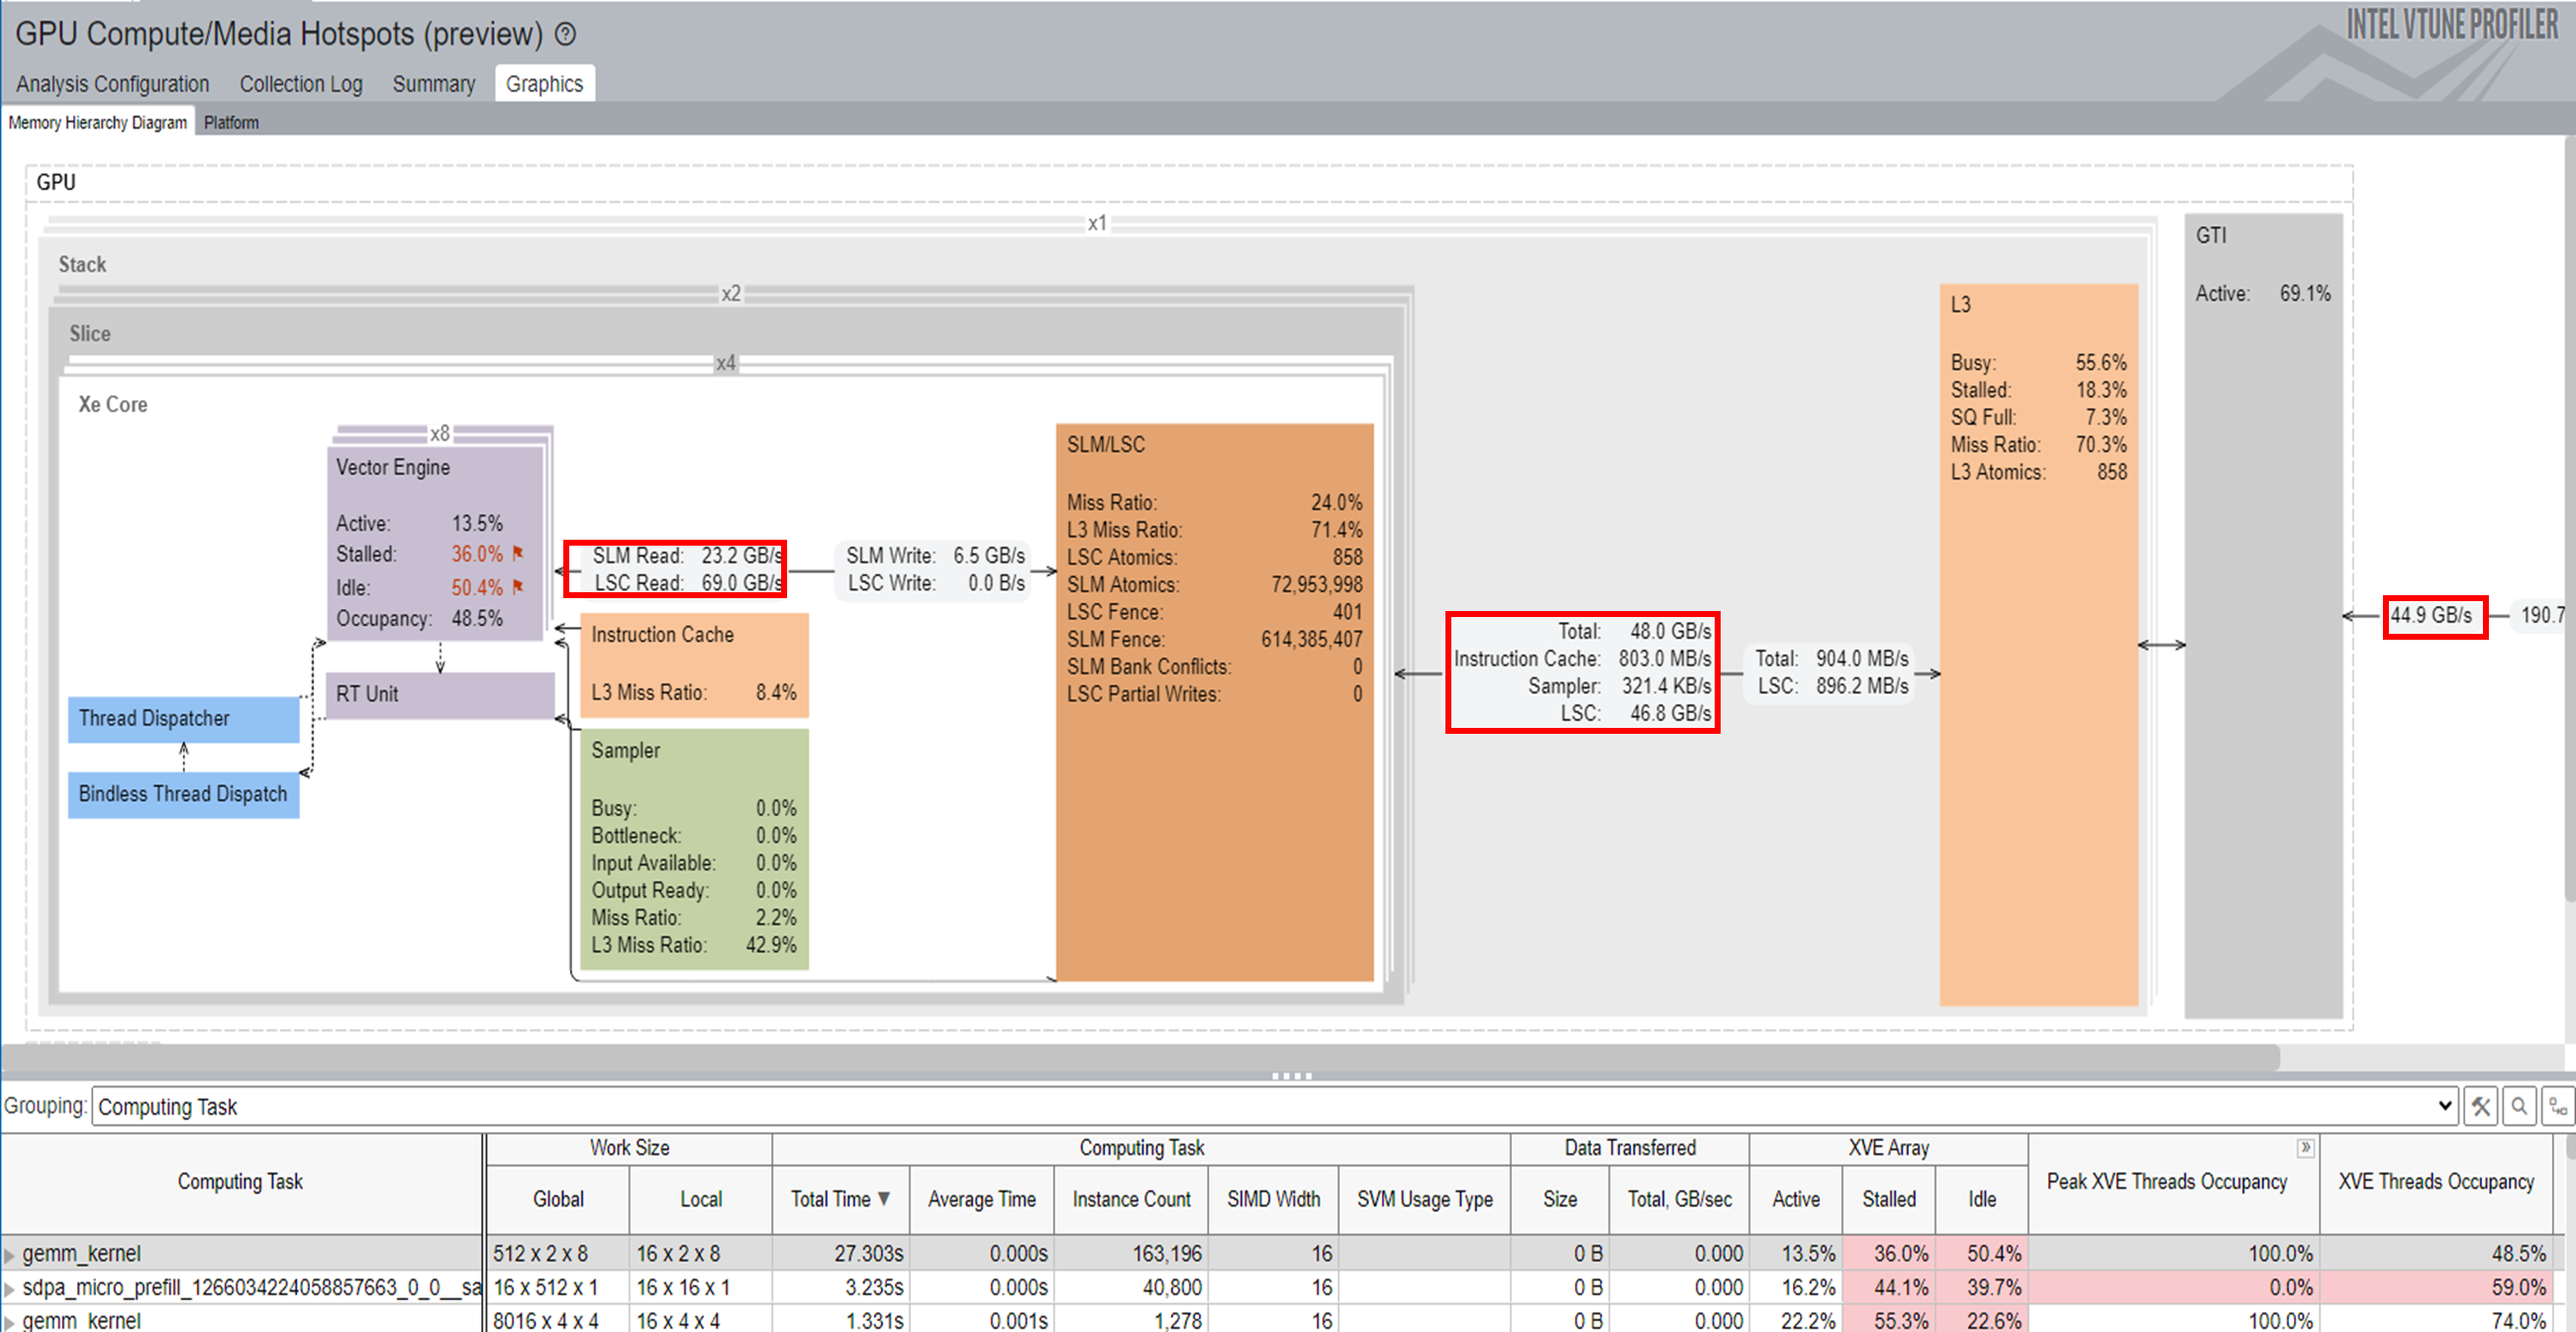


From the total inference time, the collapsed time has reduced from 85s to 73s, resulting in a 15% improvement.
Within the context of LLMs, vocabulary size refers to the total number of unique words, or tokens, that a model can recognize and use. The larger the vocabulary size, the more nuanced and detailed is the capability of the model to understand the language. For example, the vocabulary size of the Phi-3 model is 32064 and the hidden size is 3072.
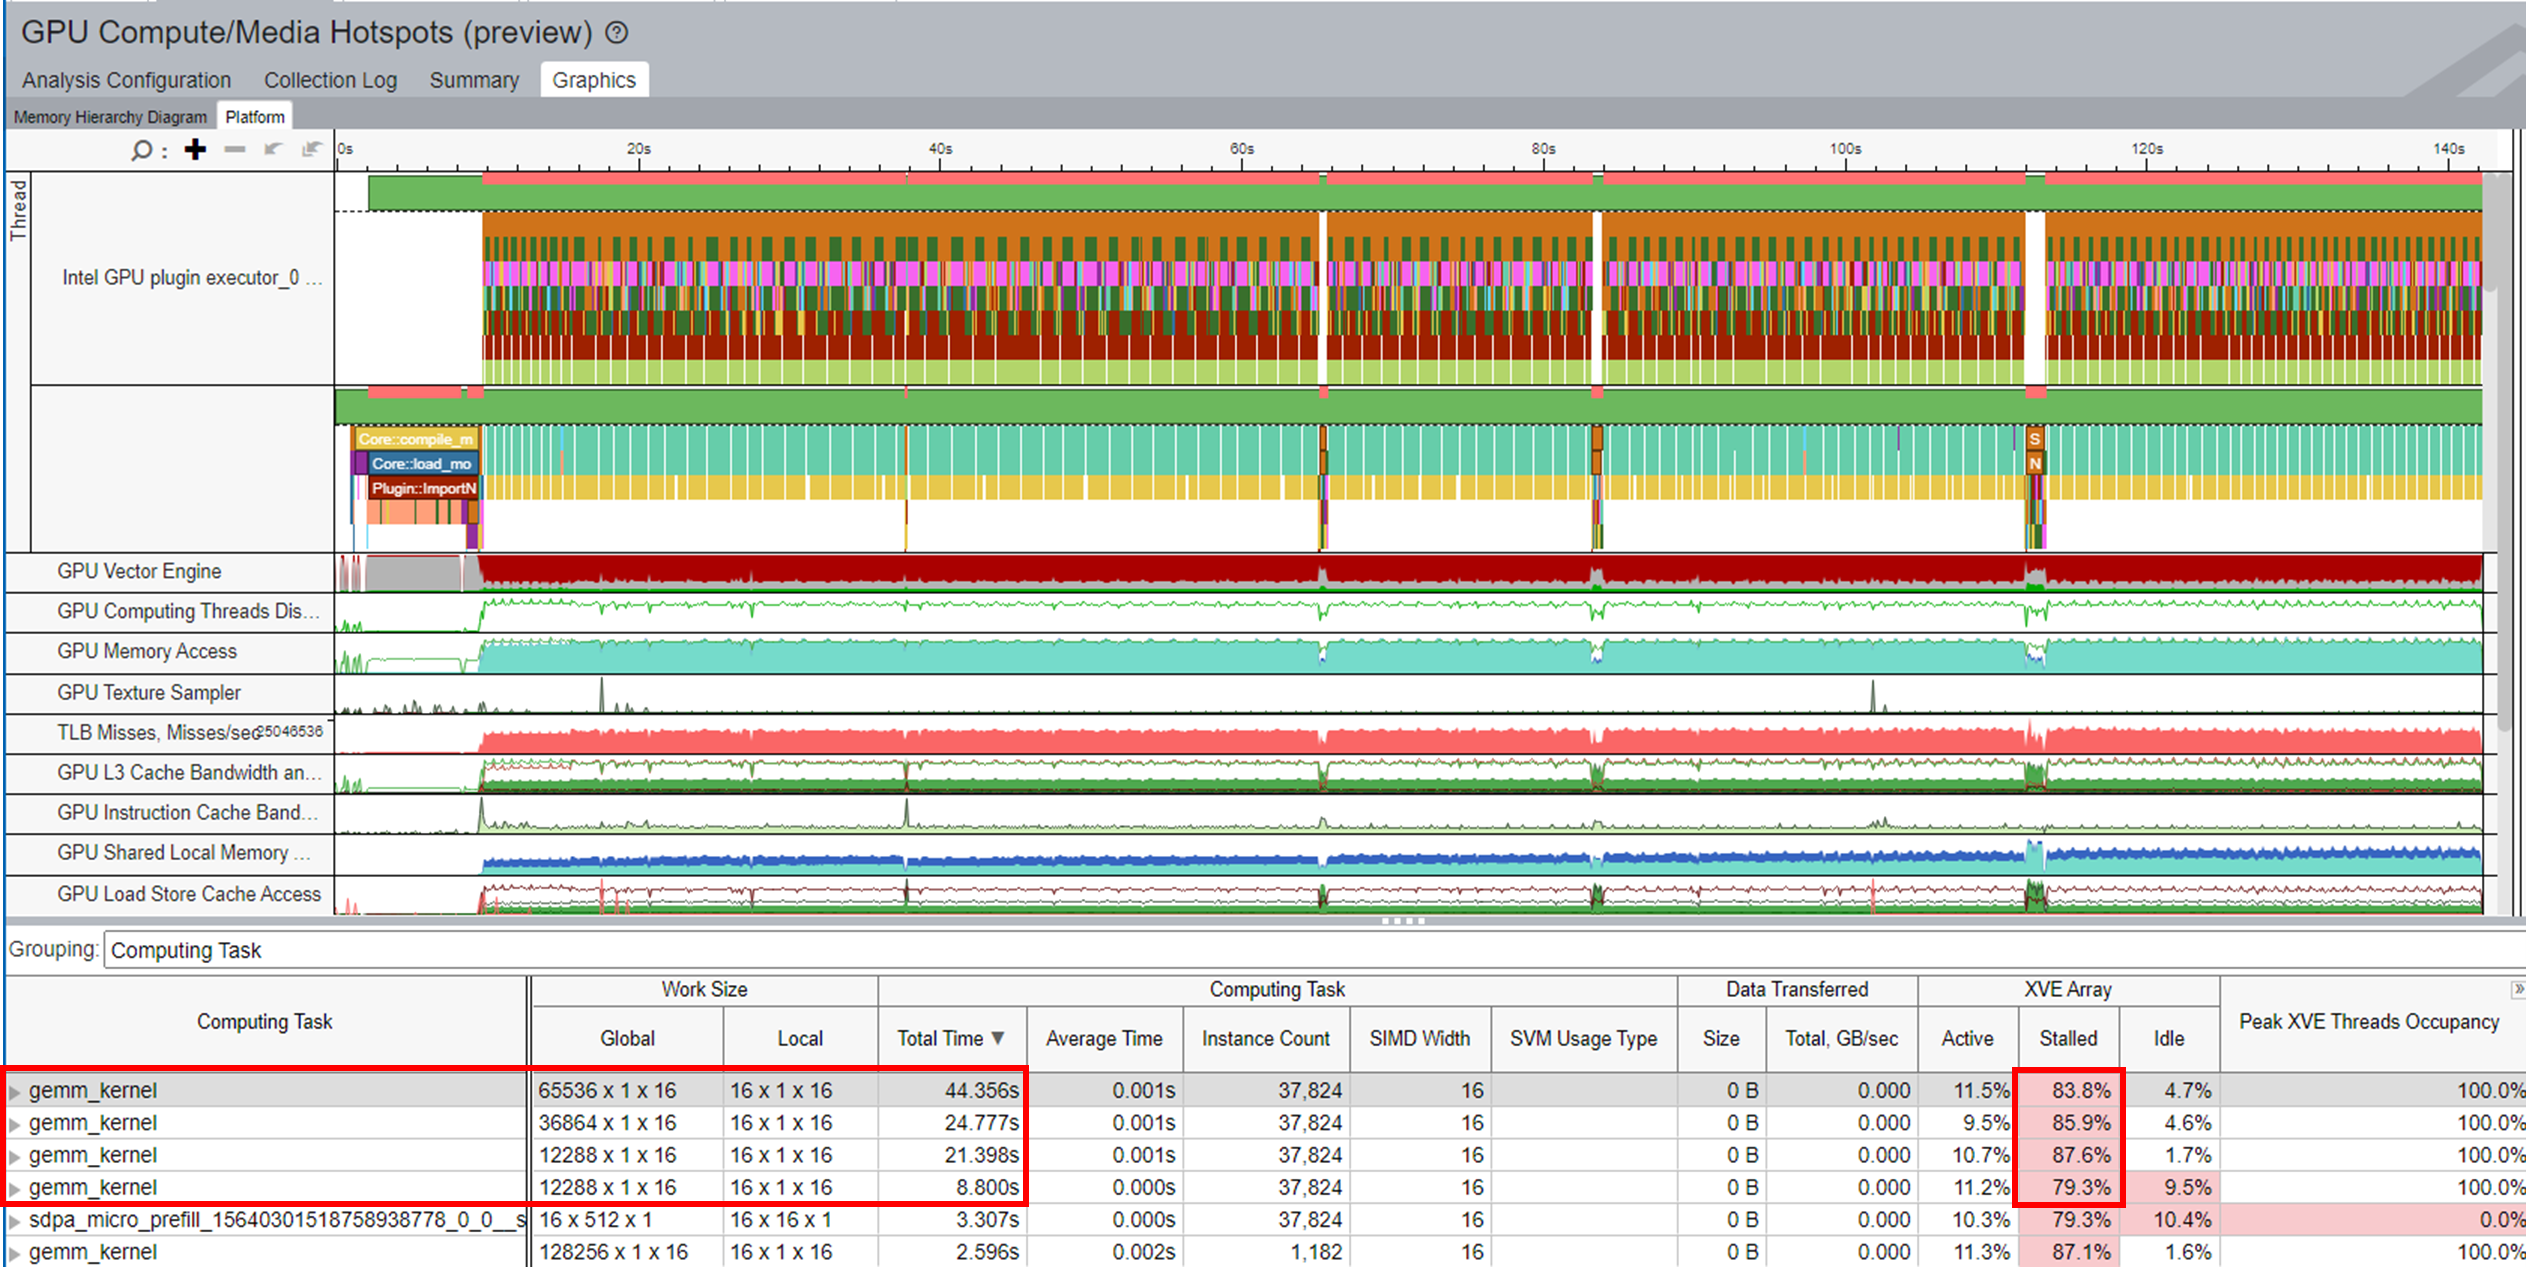
However, a large vocabulary size also requires more computational and memory resources for deployment. The figure below shows that more MatMul computation and memory are needed. As a result, the computation of the workload in this example took more time due to Stalled issues. The entire inference time took 143s.
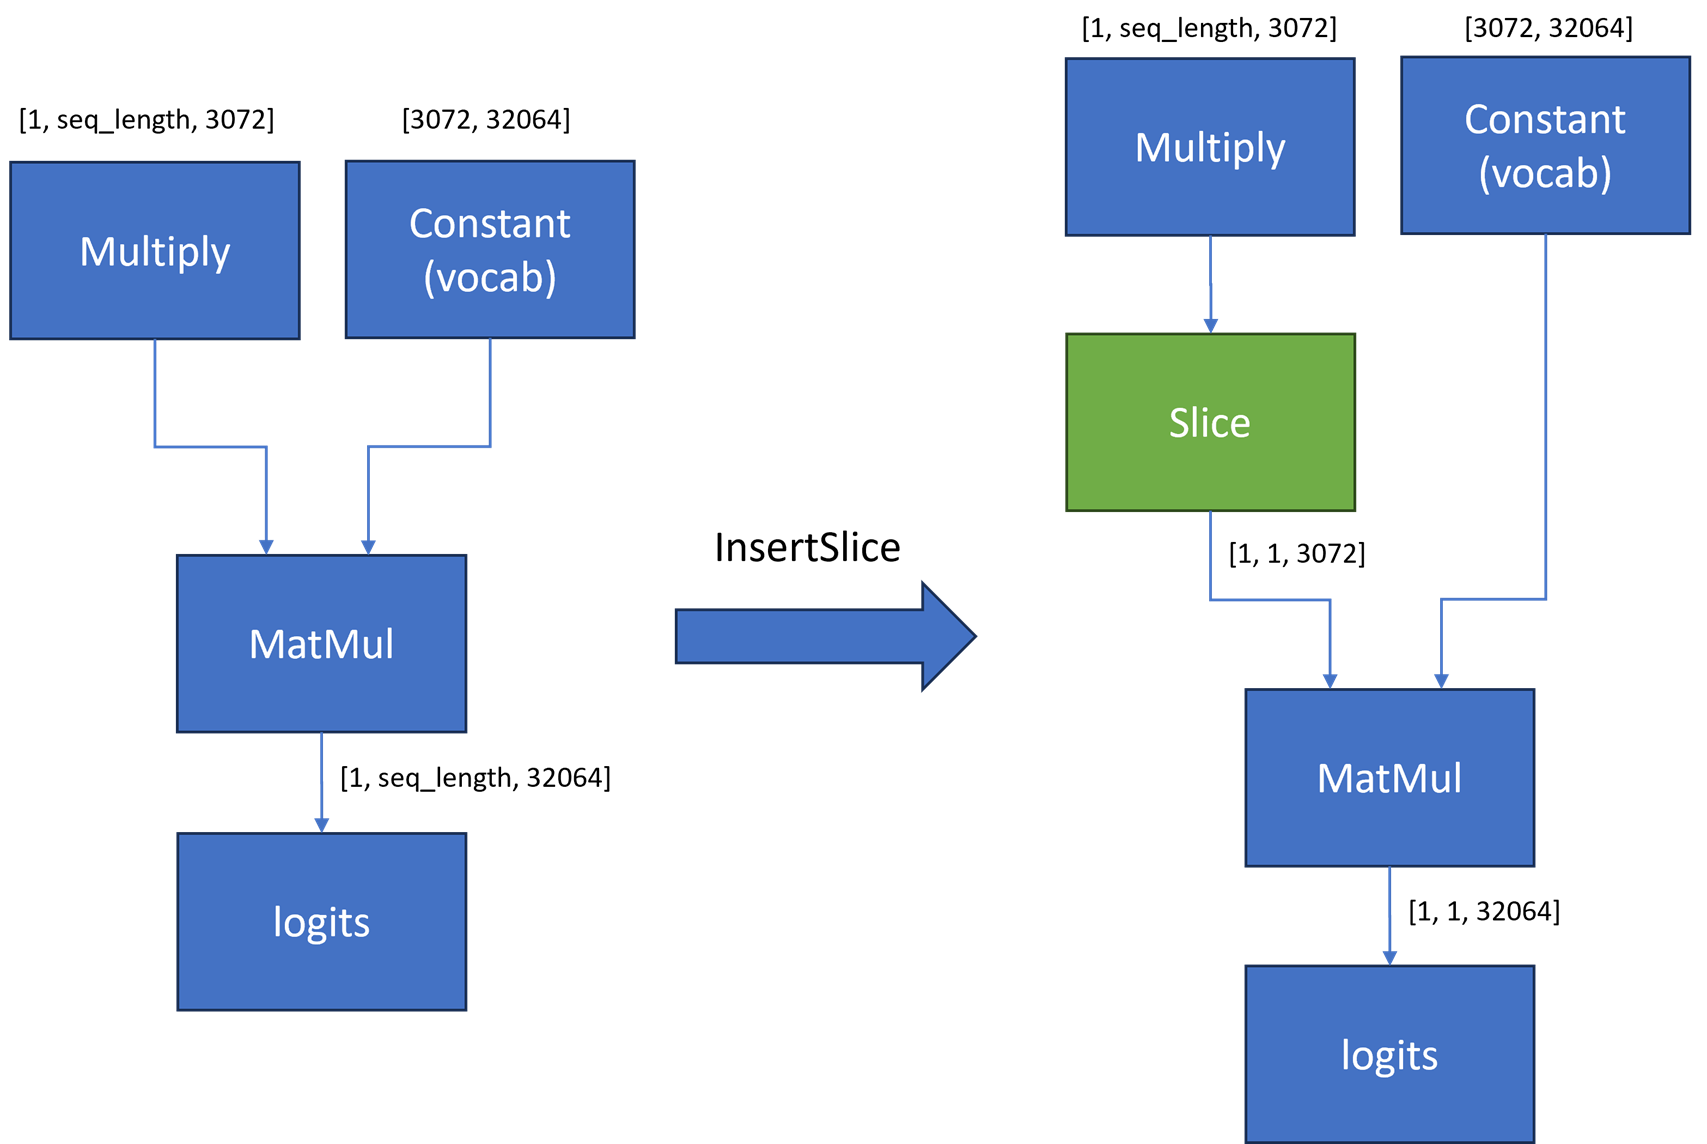
For an LLM-greedy search generation, only one token is generated by the LLM per inference. You can apply an additional graph optimization method to reduce the input shape for the last MatMul for Logits. By inserting a slice operation between Multiply and MatMul nodes, only the last element in the second dimension of the reshape node output gets extracted. For the Phi-3 model, the first input for the MatMul operator is reduced from [1, seq_len, 3072] to [1,1, 3072]. This reduction can significantly reduce the MatMul computation and memory usage.
From the figure below, you can infer these details:
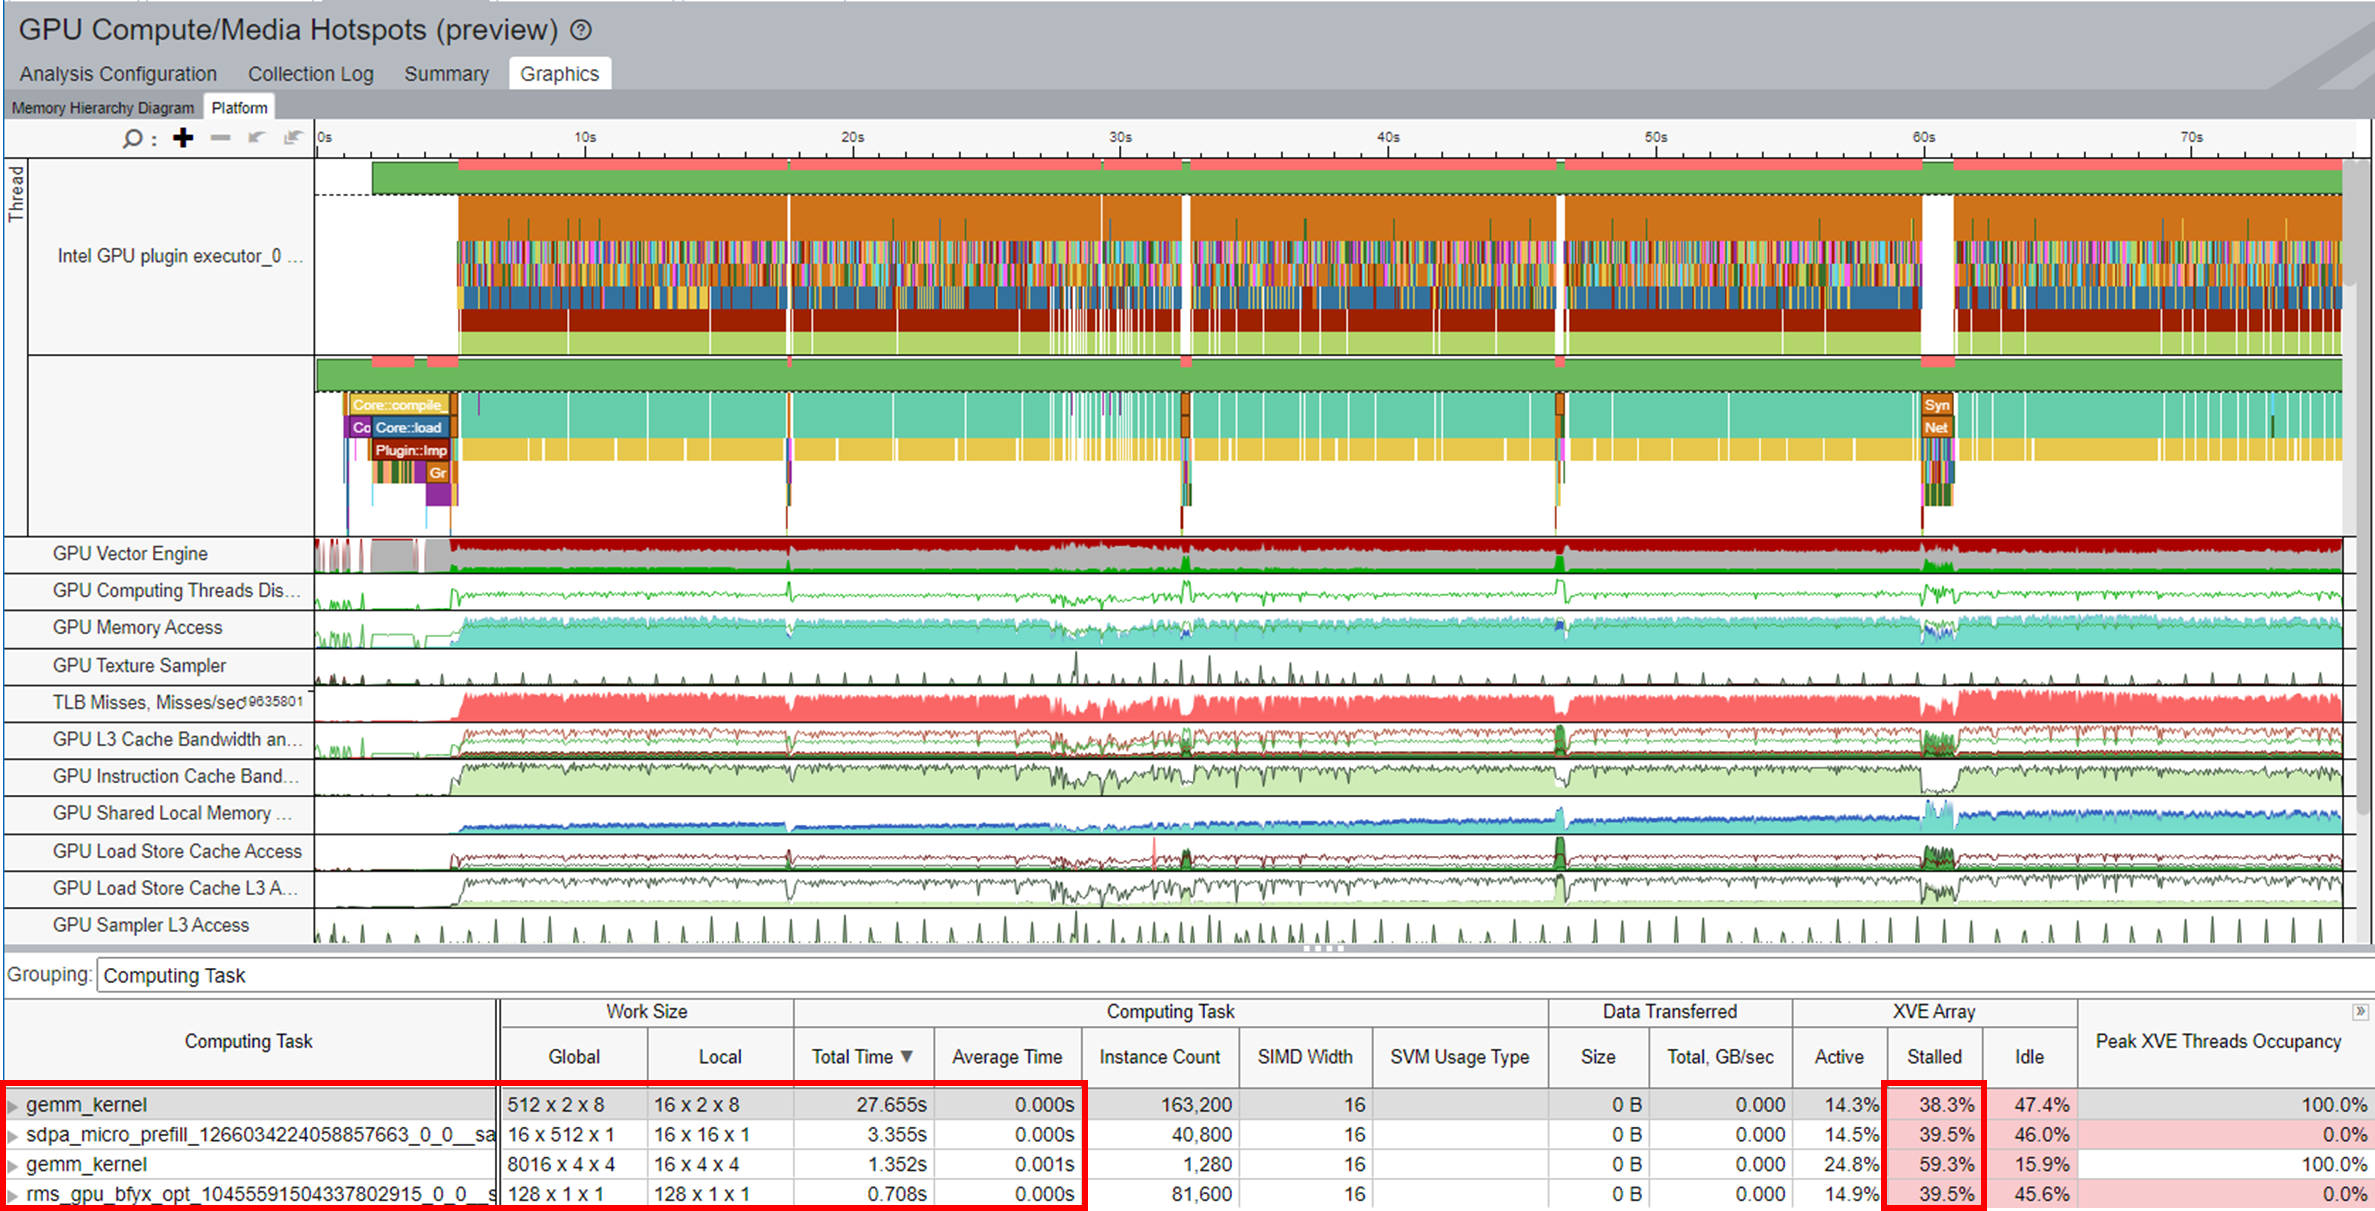
- gemm_kernel calls are significantly reduced after enabling the graph optimization.
- The Stalled issue is alleviated.
- The inference time only takes 76s.
- Performance improved up to 1x.
During the text generation process, the LLM computes the key-value (KV) values for each input token in an auto-regressive manner. This method is not efficient for recomputing the same KV values each time since the generated output becomes part of the input.
To optimize this method, a KV-cache optimization is proposed to store the past keys and values instead of computing them each time. This technique can reduce computation while bringing additional KV-cache memory transfer between host and device.
OpenVINO provides a Stateful API that implicitly preserves KV-cache as the internal state of the model between two consecutive inference calls. This KV-cache is in place of the inputs and outputs to/from the model to avoid the unnecessary overhead of memory copy. This cache can be scaled up significantly with a long input token. You can learn more about this optimization in OpenVINO Stateful models and State API.
For the stateless model in the figure below, the inference time corresponding to all five sentences gradually increases with the sentence length.
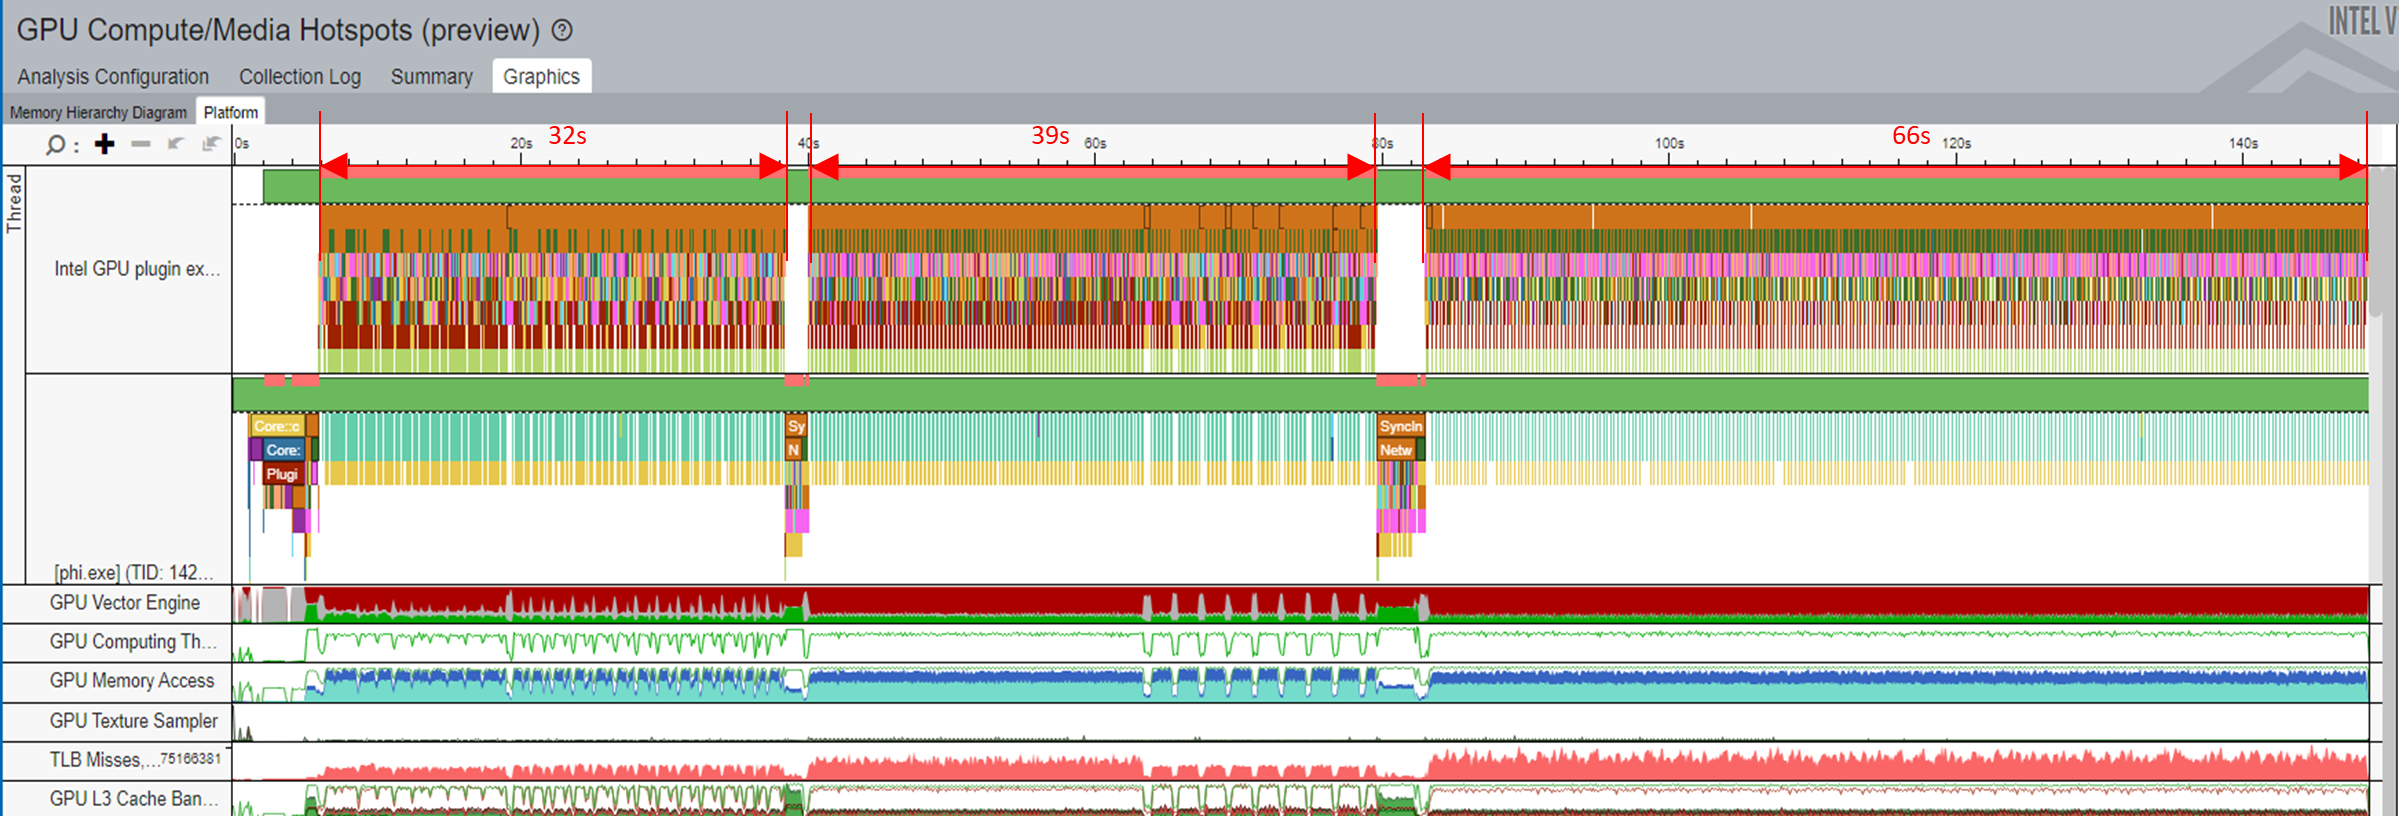
However, all changes to the inference time are very small for the stateful model shown in the graph below.

You can discuss this recipe in the Analyzers Forum.