Profiling Artificial Intelligence Applications (NEW)
Learn how to use Intel® VTune™ Profiler to profile Artificial Intelligence (AI) and Machine Learning (ML) workloads.
This recipe demonstrates how you use Intel® VTune™ Profiler to profile Python code samples that are implementations of a simple neural network. The recipe also makes use of the OpenVINOTM toolkit, which is an open-source toolkit to optimize and deploy deep learning models from the cloud to edge. The OpenVINO toolkit accelerates deep learning inference across use cases like generative AI, video, audio, and language. The toolkit uses models from popular frameworks like PyTorch, TensorFlow and Open Neural Network Exchange (ONNX).
Content Experts: Rupak Roy, Lalith Sharan Bandaru
Ingredients
Here are the hardware and software tools you need for this recipe.
Application: This recipe uses the TensorFlow_HelloWorld.py and Intel_Extension_For_PyTorch_Hello_World.py applications. Both of these code samples are implementations of a simple neural network with
- A convolution layer
- A normalization layer
- A ReLU layer which you can train and evaluate
This recipe also uses an image classification example with the MobileNet v2 model from OpenVINOTM.
Analysis Tool: User-mode sampling and tracing collection with VTune Profiler (version 2025.0 or newer)
Python Package: Intel® Distribution for Python*(version 3.10 or newer) or Miniforge
CPU: 13th Gen Intel® Core(TM) i5-13600K
Operating System: Ubuntu Server 22.04.5 LTS
Install Python Package
Follow these steps to install Intel® Distribution for Python*(version 3.10 or newer) and other necessary packages:
conda create --name py310 python=3.10 -y
conda activate py310
pip install openvino-dev onnx torch torchvision intel-extension-for-pytorch opencv-python ittapi tensorflow
Run VTune Profiler on a Python Application
Let us start by running a Hotspots analysis on the Intel_Extension_For_PyTorch_Hello_World.py ML application, without making any change to the code. This analysis is a good starting point to identify the most time-consuming regions in the code.
In the command line, type:
vtune -collect hotspots -knob sampling-mode=sw -knob enable-stack-collection=true -source-search-dir=path_to_src -search-dir /usr/bin/python3 -result-dir vtune_hotspots_results -- python3 Intel_Extension_For_PyTorch_Hello_World.py
Once the analysis is completed, see the Top Hotspots section in the Summary window to identify the most active functions in the code.
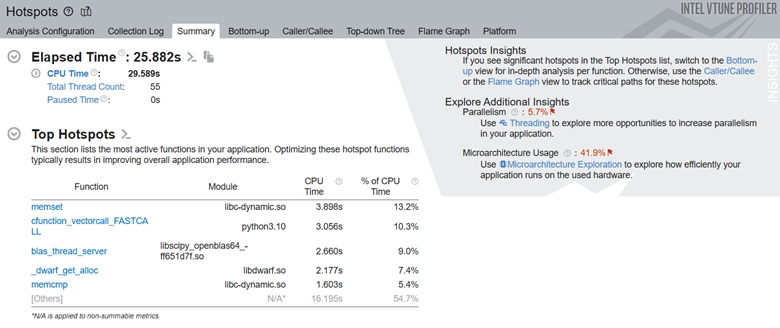
Next, let us look at the top tasks in the application:

Here we can see that the convolution task consumes the most processing time for this code.
While you can dig deeper by switching to the Bottom-up window, it may be challenging to isolate the most interesting regions for optimization. This is particularly true for larger applications because there may be many model operators and functions in every layer of the code. Let us add Intel® Instrumentation and Tracing Technology (ITT) APIs to generate results that are easy to interpret.
Include ITT-Python APIs
Let us now add Python* bindings available in ITT-Python to the Intel® Instrumentation and Tracing Technology (ITT) APIs used by VTune Profiler. These bindings include user task labels to control data collection and some user task APIs (that can create and destroy task instances).
ITT-Python uses three types of APIs:
- Collection Control APIs
- ittapi.active_region
- ittapi.collection_control.resume()
- ittapi.collection_control.pause()
- Task APIs
- ittapi.task
The following example uses ITT APIs for image classification. This example uses the MobileNet v2 model from OpenVINOTM.
Run these commands to download and convert the model:
omz_downloader --name mobilenet-v2-pytorch
omz_converter --name mobilenet-v2-pytorch
# openvino_sample.py
from openvino.runtime import Core
import cv2
import numpy as np
import os
import ittapi
import urllib

@ittapi.task()
def DownloadUrl(url, filename, force=False):
    if not force:
        if os.path.exists(filename):
            print(f'{filename} already exists. Skip download from {url}')
            return True
    print(f'Downloading  {url}')
    urllib.request.urlretrieve(url, filename)
    if os.path.exists(filename):
        print(f'Download success. File saved {filename}')
        return True
    else:
        print(f'Download Fail')
return False

pwd = os.getcwd();
ie = Core()

model_path = os.path.join(pwd,"public/mobilenet-v2-pytorch/FP32/mobilenet-v2-pytorch.xml")
compiled_model = ie.compile_model(model_path, "CPU")
output_layer = compiled_model.output(0)


# Download Image
with ittapi.task("Download Test Image") :
    image_filename = os.path.join(pwd,"dog.jpg")
    DownloadUrl("https://github.com/pytorch/hub/raw/master/images/dog.jpg", image_filename)

# Download Image Classes
with ittapi.task("Download Image classes file") :
    imagenet_classes_filename = os.path.join(pwd,"imagenet_classes.txt")
    DownloadUrl('https://raw.githubusercontent.com/pytorch/hub/master/imagenet_classes.txt', imagenet_classes_filename)

# Load Image
print(f'Loading Image : {image_filename}')
with ittapi.task("Loading image and preprocessing") :
    image = cv2.imread(image_filename)
    image = cv2.resize(image, (224,224))
    image = image.transpose(2,0,1)
    image = np.expand_dims(image,0)
    image = image.astype(np.float32)

with ittapi.task("Image classification") :
    results = compiled_model([image])[output_layer]
    probability_indexs = np.argsort(results[0])[-5:][::-1]
    probabilities = results[0][probability_indexs]

#print(f'probability_indexs : {probability_indexs}')
#print(f'probabilities : {probabilities}')
#predicted_class = np.argmax(results)

# Print probable image class in Human readable format
with ittapi.task("Display classification results") :
    print('Classification Results')
    with open(imagenet_classes_filename, "r") as f:
        categories = [s.strip() for s in f.readlines()]

    for p in (probability_indexs):
        print(f"\t{categories[p]}",)
In the sample code above, the interesting regions are marked with the ittapi.task label. To collect the top tasks along with hot spots, run:
vtune -collect hotspots -knob sampling-mode=sw -knob enable-stack-collection=true -source-search-dir=path_to_src -search-dir /usr/bin/python3 -result-dir vtune_hotspots_results -- python3 openvino_sample.py
The Top Tasks section shows the details about code portions that were instrumented with the ittapi.task label:
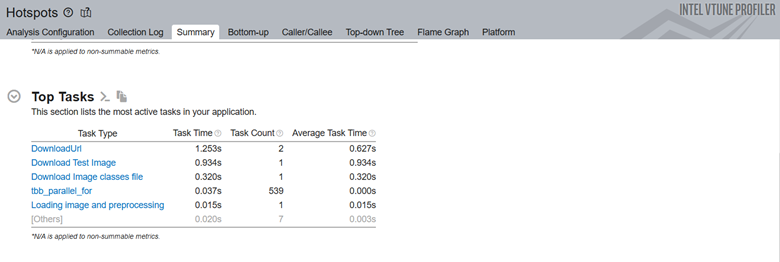
The next example from TensorFlow_HelloWorld.py calls the Domain and Task APIs in ITT-Python:
#Change#1
    with ittapi.active_region(activator=lambda: True):
        with ittapi.task("CreateOptimizer"):
            optimizer = tf.train.GradientDescentOptimizer(learning_rate)

#Change#2
    with ittapi.active_region(activator=lambda: True):
        with ittapi.task("CreateTrainer"):
            for epoch in range(0, EPOCHNUM):
                for step in range(0, BS_TRAIN):
                    x_batch = x_data[step*N:(step+1)*N, :, :, :]
                    y_batch = y_data[step*N:(step+1)*N, :, :, :]
                    s.run(train, feed_dict={x: x_batch, y: y_batch})
                '''Compute and print loss. We pass Tensors containing the predicted and true values of y, and the loss function returns a Tensor containing the loss.'''
                print(epoch, s.run(loss,feed_dict={x: x_batch, y: y_batch}))
Here is the sequence of operations in the code snippet above:
- Resume profiling just before the loop execution begins. This is the most interesting part of the code. The loop is marked with the active_region API.
- Start the task using the task API. Use the CreateTrainer label to identify the task in profiling results.
- Once the task is complete, pause data collection.
Run Hotspots and Microarchitecture Exploration Analyses
Once you have modified your code, run the Hotspots analysis on the modified code.
vtune -collect hotspots -start-paused -knob enable-stack-collection=true -knob sampling-mode=sw -search-dir=/usr/bin/python3 -source-search-dir=path_to_src -result-dir vtune_data -- python3 TensorFlow_HelloWorld.py
This command uses the -start-paused parameter to profile only those code regions marked by ITT-Python APIs. Let us look at the results of the new Hotspots analysis. The Top Hotspots section displays hotspots in the code regions marked by ITT-Python APIs. The Insights section in the upper right corner recommends additional analyses you can consider running to get a deeper understanding of these hot spots.
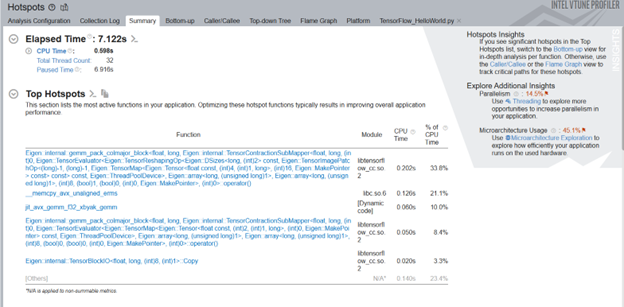
Examine the most time-consuming ML primitives in the target code region. Focus on these primitives first to improve optimization. Using the ITT-APIs helps you identify those hotspots quickly which are more pertinent to ML primitives.
Next, look at the top tasks targeted by the ITT-Python APIs. You can use these APIs to limit profiling results to specific code regions.
This example uses two ITT logical tasks:
- CreateTrainer
- CreateOptimizer
Click on these tasks to see such details as:
- CPU time
- Effective time
- Spin time
- Overhead time
- CPU utilization time
- Source code line level analysis

The source line level profiling of the ML code reveals the source line breakdown of CPU time. In this example, the code spends 3.3% of the total execution time to train the model.
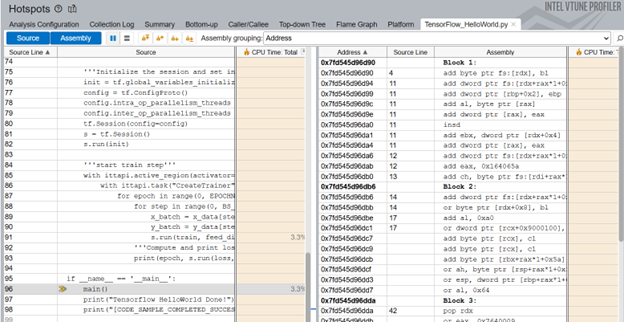
To obtain a deeper understanding of application performance, let us now run the Microarchitecture Exploration analysis. In the command window, type:
vtune -collect uarch-exploration -knob collect-memory-bandwidth=true -source-search-dir=path_to_src -search-dir /usr/bin/python3 -result-dir vtune_data_tf_uarch -- python3 TensorFlow_HelloWorld.py
Once the analysis completes, the Bottom-up window displays detailed profiling information for the tasks marked with ITT-Python APIs.
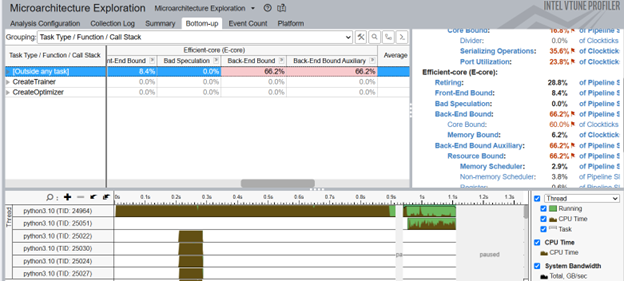
We can see that the CreateTrainer task is back-end bound. This means that a lot of time was wasted waiting to receive resources in the backend. This condition suggests issues with:
- Memory access
- Data dependencies
- Execution Unit contention
To focus your analysis on a smaller block of code, right click on one of the CreateTrainer tasks and enable filtering.
Add PyTorch* ITT APIs (for PyTorch Framework only)
Just like ITT-Python APIs, you can also use PyTorch* ITT APIs with VTune Profiler. Use PyTorch ITT APIs to label the time span of individual PyTorch operators and get detailed analysis results for customized code regions. PyTorch 1.13 provides these versions of torch.profiler.itt APIs for use with VTune Profiler:
- is_available()
- mark(msg)
- range_push(msg)
- range_pop()
Let us see how these APIs are used in a code snippet from Intel_Extension_For_PyTorch_Hello_World.py.
with ittapi.active_region(activator=lambda: True):
    with torch.autograd.profiler.emit_itt():
        torch.profiler.itt.range_push('training')
        model.train()
        for batch_index, (data, y_ans) in enumerate(trainLoader):
            data = data.to(memory_format=torch.channels_last)
            optim.zero_grad()
            y = model(data)
            loss = crite(y, y_ans)
            loss.backward()
            optim.step()
        torch.profiler.itt.range_pop()
The above example features this sequence of operations:
- Use the itt.resume() API to resume the profiling just before the loop begins to execute.
- Use the torch.autograd.profiler.emit_itt() API for a specific code region to be profiled.
- Use the range_push() API to push a range onto a stack of nested range spans. Mark it with a message ('training').
- Insert the code region of interest.
- Use the range_pop() API to pop a range from the stack of nested range spans.
Run Hotspots Analysis with PyTorch ITT APIs
Let us now run the Hotspots analysis for the code modified with PyTorch ITT APIs. In the command window, type:
vtune -collect hotspots -start-paused -knob enable-stack-collection=true -knob sampling-mode=sw -search-dir=/usr/bin/python3 -source-search-dir=path_to_src -result-dir vtune_data_torch_profiler_comb -- python3 Intel_Extension_For_PyTorch_Hello_World.py
Here are the top hotspots in our code region of interest:
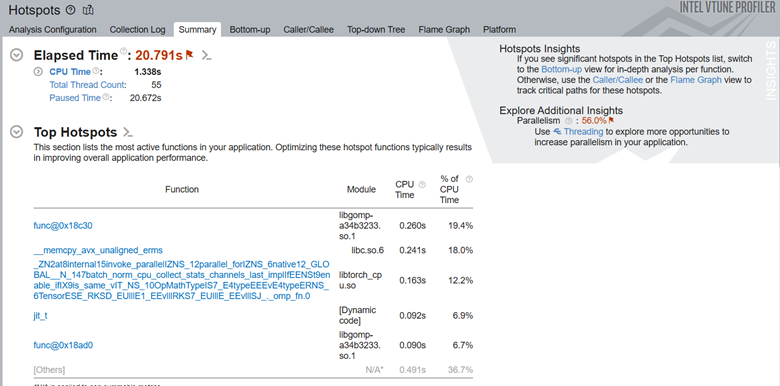
In the Top Tasks section of the Summary, we see the training task which was labeled using the ITT-API.

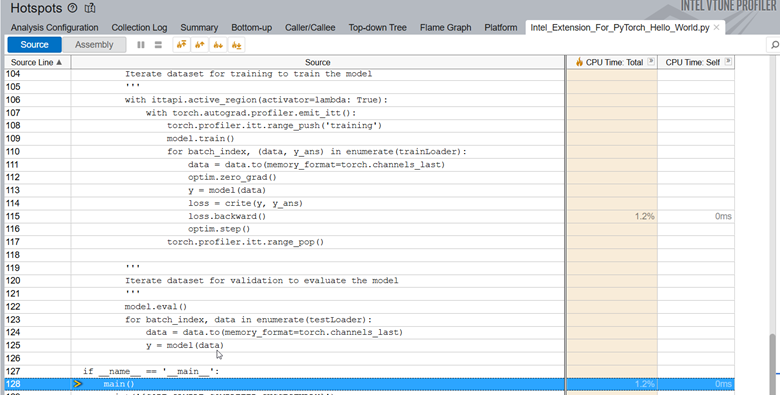
When we examine the source line profiling of the PyTorch code, we see that the code spends 1.2% of the total execution time in backpropagation.
Switch to the Platform window to see the timeline for the training task, which was marked using PyTorch* ITT APIs.
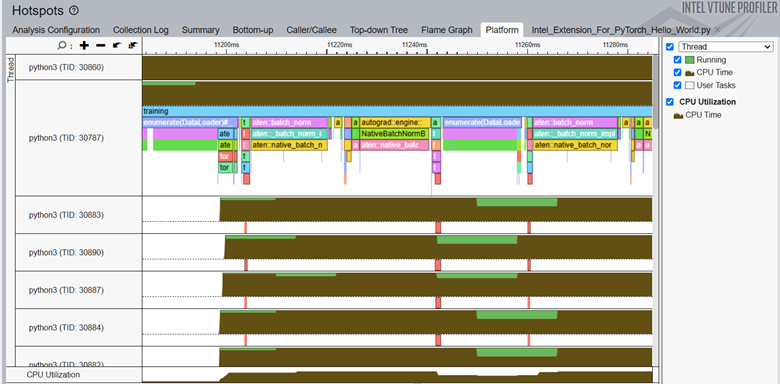
In the timeline, the main thread is python3(TID:30787) and it contains several smaller threads. Operator names that start with aten::batch_norm, aten::native_batch_norm, aten::batch_norm_i are model operators. These model operators are labeled implicitly by the ITT feature in PyTorch.
From the Platform window, you can get these details:
- CPU usage (for a specific time period) for every individual thread
- Start time
- Duration of user tasks and oneDNN primitives(Convolution, Reorder)
- Source lines for each task and primitive. Once the source file for a task/primitive is compiled with debug information, click on the task/primitive to see the source lines.
- Profiling results grouped by iteration number (when multiple iterations are available)