Custom Data Collection for Performance Analysis (NEW)
Learn how to configure a data collector to inject custom data into an analysis by Intel® VTune™ Profiler. Get additional context on the collected data and insights for an enhanced analysis.
When you collect performance data with VTune Profiler, you can configure a custom data collector to interact with the collected data. You can then inject custom data once the collection activity has been completed.
In this recipe, we will see how you can do this.
Content expert: Jeffrey Reinemann
Ingredients
Here are the hardware and software tools you need for this recipe.
Application:
- Mandelbrot: The recipe uses this sample application. You can use any application of your choice.
- CustomCollector: This batch file is used as a custom data collector. However, you can use any compiled program or Python script.
Analysis Tool: VTune Profiler version 2023 or newer - Hotspots Analysis
Understand the Data Collector
The CustomCollector data collector batch file has the following code:
@Echo Off
Echo %AMPLXE_COLLECT_CMD%
if "%AMPLXE_COLLECT_CMD%" == "start" goto start
if "%AMPLXE_COLLECT_CMD%" == "stop" goto stop
Echo Invalid command
Exit 1

:start
Rem Start command in non-blocking mode
Rem echo start my_collector_command_to_start_collection "%AMPLXE_DATA_DIR%"\data_file-hostname-%COMPUTERNAME%.csv
Start C:\Source\CustomCollectorWin\Debug\CustomCollectorWin.exe
Start C:\Source\CustomCollectorWin\Debug\CustomCollectorWin.exe 2
Start C:\Source\CustomCollectorWin\Debug\CustomCollectorWin.exe 4
Exit 0

:stop
Echo stop "%AMPLXE_DATA_DIR%\..\log\CustomCollector0PID.txt"
Echo|set /p="taskkill /PID " > "%TEMP%\stop0.bat
type "%AMPLXE_DATA_DIR%\..\log\CustomCollector0PID.txt" >> "%TEMP%"\stop0.bat
Call "%TEMP%"\stop0.bat
Exit 0
Echo stop "%AMPLXE_DATA_DIR%\..\log\CustomCollector2PID.txt"
Echo|set /p="taskkill /PID " > "%TEMP%\stop2.bat
type "%AMPLXE_DATA_DIR%\..\log\CustomCollector2PID.txt" >> "%TEMP%"\stop2.bat
Call "%TEMP%"\stop2.bat
Echo stop "%AMPLXE_DATA_DIR%\..\log\CustomCollector4PID.txt"
Echo|set /p="taskkill /PID " > "%TEMP%\stop4.bat
type "%AMPLXE_DATA_DIR%\..\log\CustomCollector4PID.txt" >> "%TEMP%"\stop4.bat
Call "%TEMP%"\stop4.bat
Exit 0
The collector uses several environment variables including AMPLXE_COLLECT_CMD, a collect command argument which specifies whether to start, stop, pause, or resume the collection. The batch file implements the start and stop options only.
Other environment variables include AMPLXE_DATA_DIR, the data directory path name where you write custom data which will be integrated into the analysis results.
When you run the CustomCollector batch file, multiple instances of the custom data collector execute and collect different metrics. Each instance provides two custom data variables for a total of six variables from the three instances.
Run Hotspots Analysis
Open VTune Profiler.
Click the Configure Analysis button to set up a new analysis.
Set these fields:
- In the WHERE pane, select Local Host.
- In the HOW pane, select Hotspots Analysis in the Algorithm group in the Analysis Tree.
- In the WHAT pane, select an application, process ID, or system-wide collection. This example uses the Mandelbrot application.
- Also in the WHAT pane, expand the Advanced Options section. Use the Custom Collector text box to navigate to the CustomCollector batch file.
Click the Command Line button
 and run this analysis from the command line.
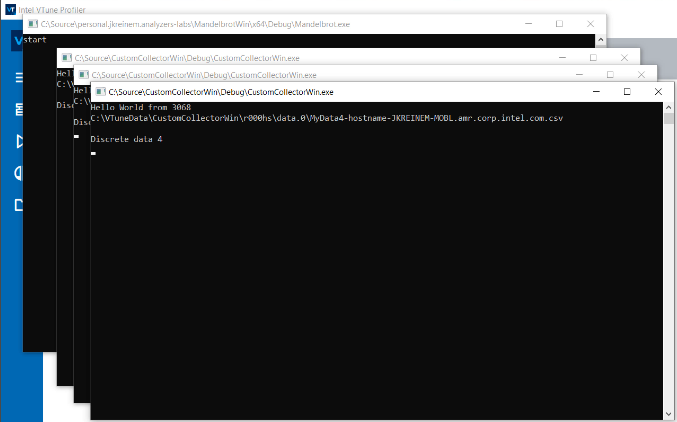
When the data collection begins, four output windows display:
One instance for the Mandelbrot application
Three instances for the CustomCollector data collector

When the data collection finishes, VTune Profiler calls the custom data collector with the stop command in AMPLXE_COLLECT_CMD. The collector writes its custom data into the VTune Profiler results directory in AMPLXE_DATA_DIR.
VTune Profiler then integrates the custom data into the results during the finalization phase of the collection.
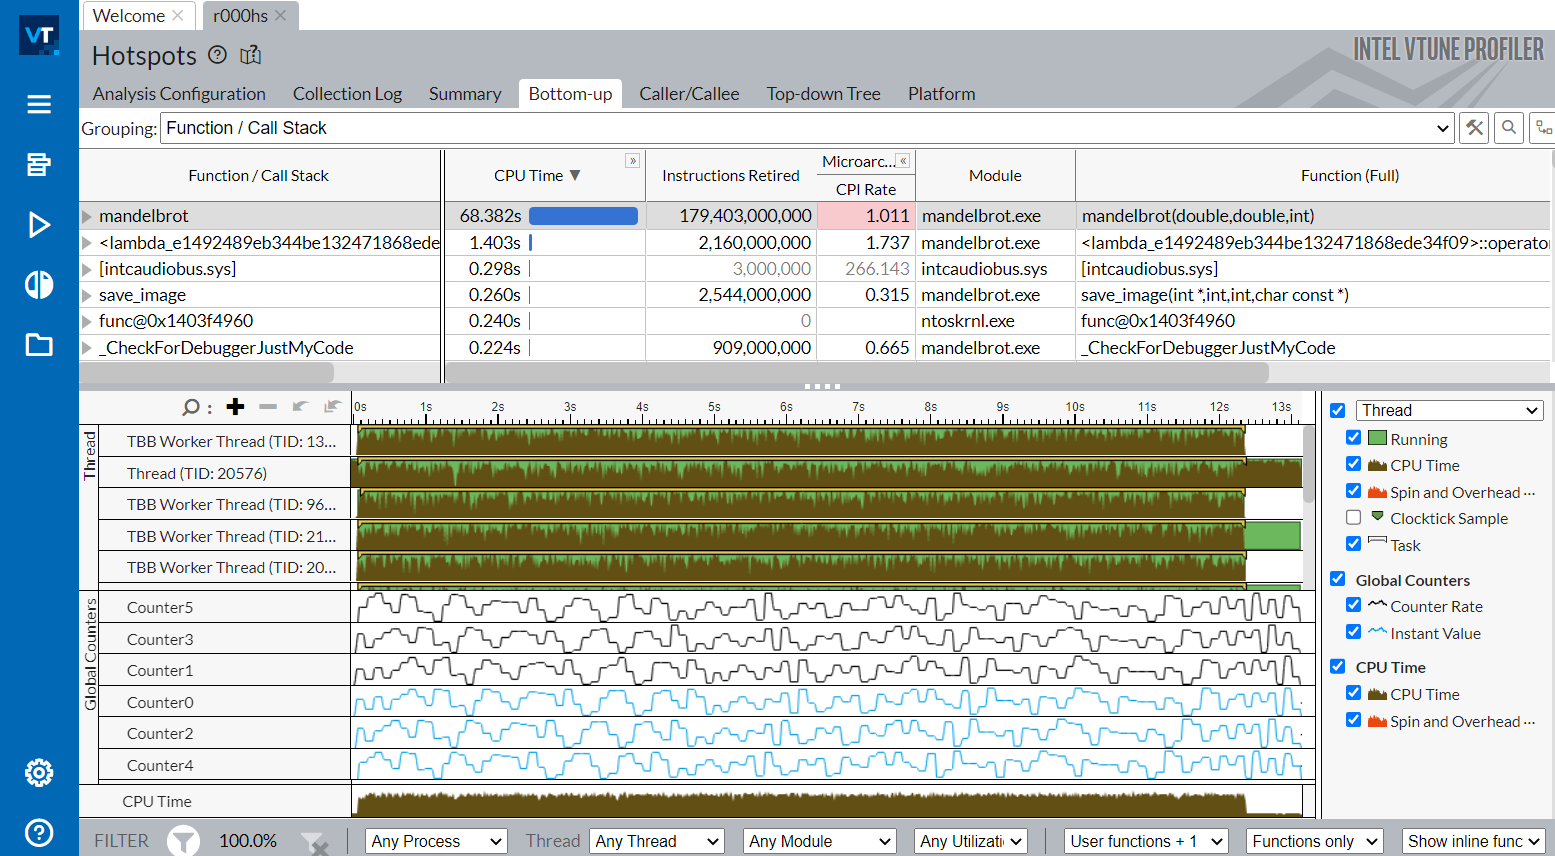
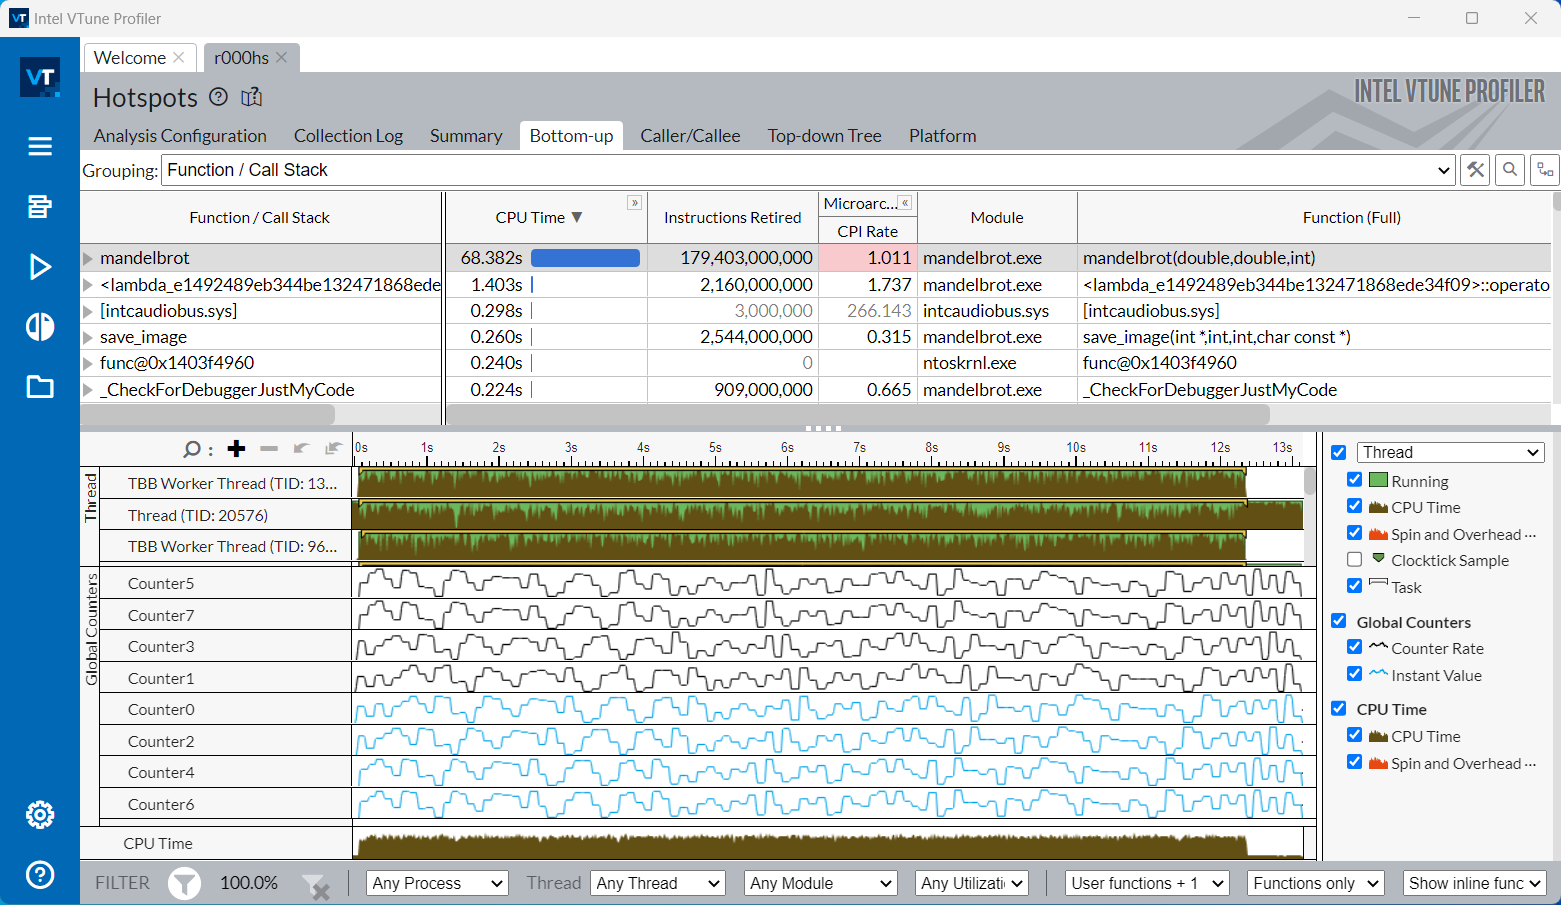
Once the results display, switch to the Bottom-up tab to see the custom data on the timeline. In this example,
- Custom data counters 0,2, and 4 display as Instant Values.
- Custom data counters 1,3, and 5 display as Counter Rate.

Use the Custom Data File
Let us now examine the custom data files that were created during our analysis.
Open the folder containing VTune Profiler results. Look in the data subfolder which contains all of the three custom data files.
The naming convention for custom data files is:
<user-defined string>-hostname-<host name of system under test>.csvFor example,
MyData-hostname-<host name of system under test>.csv
The header of the custom data file indicates the name of the metric it captured and the corresponding data type. For example, the header in the custom data file below indicates that counter 0 is an Instant Value and counter 1 is a Counter Rate.

Each line of data in the custom file must start with a time stamp to map it with other data collected at that time.
The following examples explain how you can use the custom data file in different ways:
- Generate a time stamp
- Write discrete data type information
- Format the path name
- Append existing custom data
- Display custom interval data
This example demonstrates how you can generate a time stamp for each line of data using time and GetSystemTime calls.
#define UTC_FORMAT "%Y-%m-%d %H:%M:%S"
char* get_utc_time()
{
    SYSTEMTIME    system_time;
    static time_t previous_local_time;
           time_t local_time;
    struct tm     gm_time;
           int    millisec;
           char   *time_fmt = NULL;

    time(&local_time);
    GetSystemTime(&system_time);
    millisec = system_time.wMilliseconds;
    if ((millisec == 0) && (local_time == previous_local_time))
        local_time++; // missed second rollover
    gmtime_s(&gm_time, &local_time);
    previous_local_time = local_time;

    time_fmt = (char *) malloc(128);
    if (time_fmt)
    {
        strftime(time_fmt, 128, UTC_FORMAT, &gm_time);
        sprintf_s(time_fmt, 128, "%s.%03d", time_fmt, millisec);
    }

    return time_fmt;
} // get_utc_time
This example demonstrates how you can write the Instant Value and Counter Rate of a discrete data type to the custom data file.
// Discrete data format: tsc.[QPC|CLOCK_MONOTONIC_RAW|RDTSC|UTC],CounterName1.COUNT|INST[,CounterName2.COUNT|INST],[pid],[tid]
#define DISCRETE_FORMAT_1 "%s,%llu,%llu,,\n"
#define DISCRETE_FORMAT_2 "%s,%llu,%llu,%lu,\n"
#define DISCRETE_HEADER "tsc.UTC,Counter%c.COUNT,Counter%c.COUNT,pid,tid\n"
void write_discrete_data(FILE *file_out, char *buffer, uint64_t tsc, uint64_t counter1, uint64_t counter2, DWORD dPid, DWORD dTid)
{
    char   *utc_time     = get_utc_time();
    size_t bytes_written = 0;

    if (buffer && file_out && utc_time)
    { // buffer and file_out valid

        if ((dPid == 0) && (dTid == 0))
            sprintf_s(buffer, BUFFER_SIZE, DISCRETE_FORMAT_1, utc_time, counter1, counter2);
        else
            sprintf_s(buffer, BUFFER_SIZE, DISCRETE_FORMAT_2, utc_time, counter1, counter2, dPid);

        bytes_written = fwrite(buffer, strlen(buffer), 1, file_out);
        fflush(file_out);
    }

    if (utc_time)
        free(utc_time);
} // write_discrete_data
This example demonstrates how you can format the full path name to the custom data file (which will be created for a collection instance) using the environment variables of VTune Profiler.
 if (command)
        _dupenv_s(&command, &length, "AMPLXE_COLLECT_CMD");
    length = BUFFER_SIZE;
    if (datadir)
        _dupenv_s(&datadir, &length, "AMPLXE_DATA_DIR");
    if (filename && hostname)
    { // filename and hostname valid
        length = BUFFER_SIZE;
        _dupenv_s(&hostname, &length, "COMPUTERNAME");

        // log my process id so CustomCollector.bat can stop me
        sprintf_s(filename, BUFFER_SIZE, "%s\\..\\log\\CustomCollector%cPId.txt", datadir, instance_id);
        printf("Data file: %s\n", filename);
        fopen_s(&file_out, filename, "wb");
        if (file_out)
        { // file_out valid
            sprintf_s(buffer, BUFFER_SIZE, "%u", my_pid);
            fwrite(buffer, strlen(buffer), 1, file_out);

            fclose(file_out);
            file_out = NULL;
        }

        // Note: appending .amr.corp.intel.com is unique to my test environment
        sprintf_s(filename, BUFFER_SIZE, "%s\\MyData%c-hostname-%s.amr.corp.intel.com.csv", datadir, instance_id, hostname);
        std::cout << filename << std::endl;

        errnum = fopen_s(&file_out, filename, "wb");
Append Existing Custom Data
Suppose you have a custom data collector that runs independent of the VTune Profiler custom collector interface. If you want to include this data in your analysis results, you must make sure to run the independent data collector during the VTune Profiler analysis run. VTune Profiler includes only data with time stamps within its running time frame.
You must also ensure that the custom data file for the independent data collector adheres to the file name specifications and formatting rules seen earlier.
For example, this custom data file adds counters 6 and 7 to the results.

Once the new custom data file is copied into the data subdirectory of VTune Profiler results,
- In the VTune Profiler GUI, open the Collection Log tab.
- Click the Re-resolve button (
 ) to finalize the data again. This includes the new custom data file that has time stamps in the range of the collection time of VTune Profiler.
 - After finalization, switch to the Bottom-up tab and observe that counters 6 and 7 display in the data.

Display Custom Interval Data
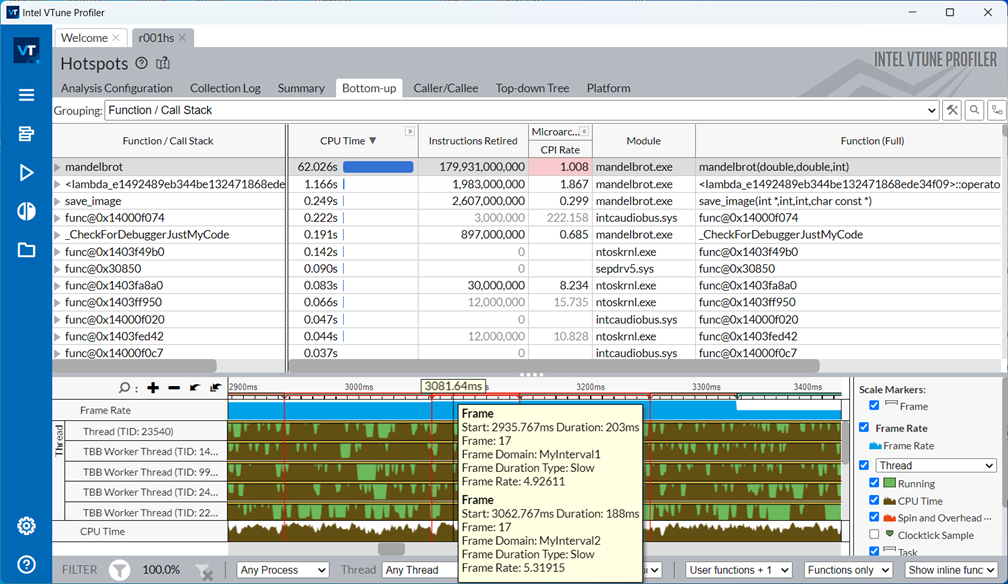
When you collect custom Interval Data, after finalization of results, this information appears in the Frame Rate swim lane of the timeline.
In the following example, there are two overlapping custom interval data - MyInterval1 and MyInterval2. In the pop-up window below, you can see the start time of each interval. Hover your mouse over the timeline to see all active intervals along with their start times and durations.

The custom interval data file must adhere to the same naming and formatting conventions explained previously:
- The file name follows the structure <user-defined string>-hostname-<host name of system under test>.csv.
- The header indicates the interval name, start, and stop times. The header may also include program and thread IDs.

This example demonstrates how you can write interval data to the custom data file.
// You can mix multiple intervals in the data. Starting one interval stops the previous interval.
// The format for the interval data is name,start_tsc.[QPC|CLOCK_MONOTONIC_RAW|RDTSC|UTC],end_tsc,[pid],[tid]
#define INTERVAL_FORMAT "%s,%s,%s,,\n"
#define INTERVAL_FORMAT_2 "%s,%s,%s,%lu,\n"
#define INTERVAL_HEADER "name,start_tsc.UTC,end_tsc,pid,tid\n"
void write_interval_data(FILE* file_out, char* buffer, const char* name, char *start_utc, char *end_utc, DWORD dPid, DWORD dTid)
{
    size_t bytes_written = 0;

    if (buffer && file_out)
    { // buffer and file_out valid
        if ((dPid != 0) || (dTid != 0))
            sprintf_s(buffer, BUFFER_SIZE, INTERVAL_FORMAT_2, name, start_utc, end_utc, dPid);
        else
            sprintf_s(buffer, BUFFER_SIZE, INTERVAL_FORMAT, name, start_utc, end_utc);
        bytes_written = fwrite(buffer, strlen(buffer), 1, file_out);
        fflush(file_out);
        if (bytes_written < 1)
            std::cout << "fwrite() failed\n";
    }
} // write_interval_data