Profiling High Bandwidth Memory Performance on Intel® Xeon® CPU Max Series (NEW)
Use Intel® VTune™ Profiler to profile memory-bound workloads in high performance computing (HPC) and artificial intelligence (AI) applications which utilize high bandwidth memory (HBM).
As HPC and AI applications grow increasingly complex, these memory-bound workloads are increasingly challenged by memory bandwidth. High bandwidth memory (HBM) technology in the Intel® Xeon® CPU Max Series of processors tackles the bandwidth challenge. This recipe describes how you use VTune Profiler to profile HBM performance in these memory-bound applications.
Content Experts: Vishnu Naikawadi, Min Yeol Lim, and Alexander Antonov
In this recipe, you use VTune Profiler to profile a memory-bound application on a system that has HBM memory.VTune Profiler displays HBM-specific performance metrics which can help you understand the usage of HBM memory by the workload. Thus, you can analyze the performance of the workload in the context of HBM memory.
The Intel® Xeon® CPU Max Series of processors offers HBM in three memory modes:
HBM Only |
HBM Flat Mode |
HBM Caching Mode |
|
|---|---|---|---|
Memory Configuration |
HBM Memory. No DRAM.
|
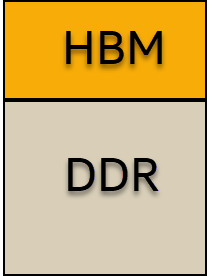
Flat memory regions with HBM and DRAM
|
HBM caches DRAM
|
Workload Capacity |
64 GB or less |
64 GB or more |
64 GB or more |
Code Change |
No code change. |
Code change may be necessary to optimize performance. |
No code change. |
Usage |
System boots and operates with HBM only. |
Provides flexibility for applications that require large memory capacity. |
Blend of HBM Only and HBM Flat Mode. Whole applications may fit in HBM cache. This mode blurs the line between cache and memory. |
When you do not install DRAM, the processor operates in HBM Only mode. In this mode, HBM is the only memory available to the OS and all applications. The OS may see all of the installed HBM, while applications can only see what is exposed by the OS.
When you install DRAM, you can select different HBM memory modes by changing the BIOS memory mode configuration:
- Open EDKII Menu.
- In the Socket Configuration option, select Memory Map.
- Open Volatile Memory.
NOTE:The UI path to change the BIOS configuration may vary depending on the BIOS running on your system.
- Change the HBM mode:
- To select the HBM Flat mode, select 1LM (or 1-Level Mode). This mode exposes the HBM and DRAM memories to the software. Each memory is available as a separate address space (NUMA node).
- To select the HBM Cache mode, select 2LM (or 2-Level Mode). In this mode, only the DRAM address space is visible. HBM functions as a transparent memory-side cache for DRAM.
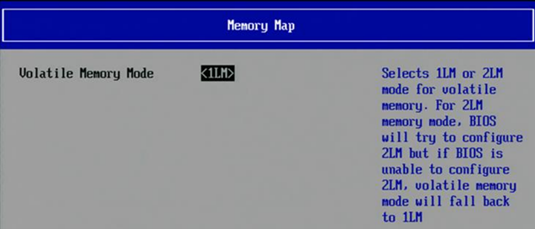
Depending on your BIOS, additional changes may be necessary. For more information on switching between memory modes, see the Intel® Xeon® CPU Max Series Configuration and Tuning Guide.
Ingredients
Here are the hardware and software tools you need for this recipe.
Application: This recipe uses the STREAM benchmark.
Analysis Tools:
- VTune Profiler (version 2024.0 or newer)
- numactl - Use this application to control NUMA policy for processes or shared memory.
CPU: 4th Generation of Intel® Xeon® CPU Max Series processors (formerly code-named Sapphire Rapids HBM)
Operating System: Linux* OS
System Configuration
This recipe uses a system with:
- 2-socket, 224 logical CPUs with Hyper-Threading
- 16 32GB DRAM DIMMs (8 DIMMs for each socket)
- HBM Flat mode with SNC4 enabled
As shown in the table below, the system used in this recipe has 8 NUMA nodes per socket:
| Socket 0 | Socket 1 | |
|---|---|---|
DRAM |
Nodes 0,1,2,3 |
Nodes 4,5,6,7 |
HBM |
Nodes 8,9,10,11 |
Nodes 12,13,14,15 |
Directions
Run Memory Access Analysis
In this recipe, you use VTune Profiler to run the Memory Access analysis type on the STREAM benchmark. You can run the VTune Profiler standalone application on the target system or use a web browser to access the GUI by running VTune Profiler Server.
This example uses VTune Profiler Server. To set up the server, on your target platform, run this command:
/opt/intel/oneapi/vtune/latest/bin64/vtune-backend --web-port <port_id> --allow-remote-access --data-directory /home/stream/results --enable-server-profiling
Here:
- --web-port is the HTTP/HTTPS port for the web server UI and data APIs
- --allow-remote-access enables remote access through a web browser
- --data-directory is the root directory to store projects and results
- --enable-server-profiling enables the selection of the hosting server as the profiling target
This command returns a token and a URL. Now you are ready to start the analysis.
This recipe describes how VTune Profiler profiles the STREAM application using only HBM NUMA nodes. For this specific system configuration, the analysis uses NUMA nodes 8-15.
- Open the URL returned at the command prompt.
- Set a password to use VTune Profiler Server.
- From the Welcome screen, create a new project.
- In the Configure Analysis window, set these options:
Pane Option Setting WHERE - VTune Profiler Server WHAT Target Launch Application Application Path to the numactl application.
NOTE:Although STREAM is the actual application that gets profiled, you specify the numactl tool as the application in order to set NUMA affinity for the STREAM benchmark. You provide the benchmark in the Application parameters field instead.
Application parameters HBM NUMA nodes 8-15
Path to STREAM benchmark
Working directory Path to application directory
HOW Analysis type Memory Access Analysis
- Click Start to run the analysis.
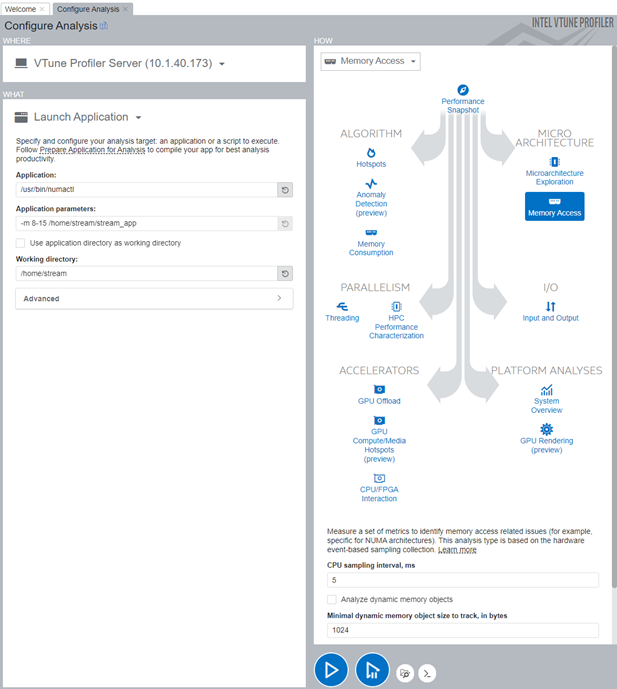
In this default configuration, VTune Profiler collects HBM bandwidth data in addition to DRAM bandwidth. Therefore, you do not require additional settings.
vtune -collect memory-access --app-working-dir=/home/stream -- /usr/bin/numactl -m “8-15” /home/stream/stream_app
Analyze Results
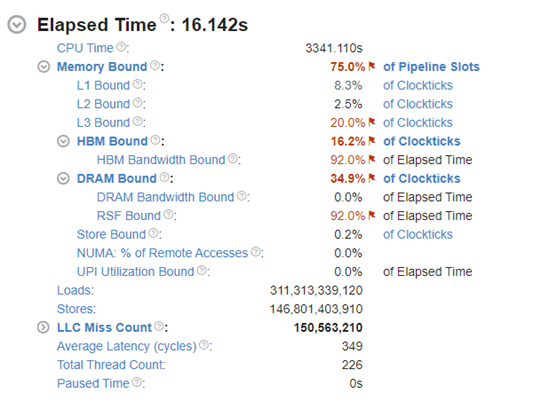
Once data collection is complete and VTune Profiler displays the results, open the Summary window to see general information about the execution. The information is sorted into several sections.
This section contains the following statistics:
- Application execution per pipeline slots or clockticks
- Total Elapsed Time - This includes idle time
- CPU Time - This is the sum of CPU times of all threads and the Paused Time, which indicates the total time the application was paused (by commands from the GUI, CLI, or user API)
- HBM Bound - This metric estimates how often the CPU was stalled due to High Bandwidth Memory (HBM) accesses by loads. This metric is measured in CPU cycles or clockticks. Depending on the workload you choose, this metric may be less accurate in data collections in the HBM Only and HBM Flat modes.
- HBM Bandwidth Bound - This shows the percentage of Elapsed Time that used HBM bandwidth. This metric is measured in terms of elapsed time.
Next, see the Platform Diagram, which presents the following information:
- System topology
- Average DRAM and HBM bandwidths for each package
- Utilization metrics for Intel® Ultra Path Interconnect (Intel® UPI) cross-socket links and physical cores
Suboptimal application topology can cause cross-socket traffic, which in turn can limit the overall performance of the application.

In this section, observe the bandwidth utilization in different domains. In this example, the system uses DRAM, UPI, and HBM domains.
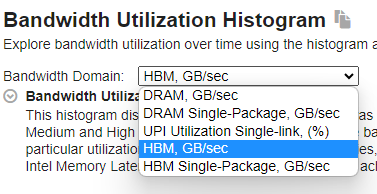
To see the overall HBM utilization across the entire system, in the Bandwidth Domain pulldown menu, select HBM, GB/sec. This information displays in a histogram of bandwidth utilization (GB/sec) vs the aggregated elapsed time (sec) for each bandwidth utilization group.
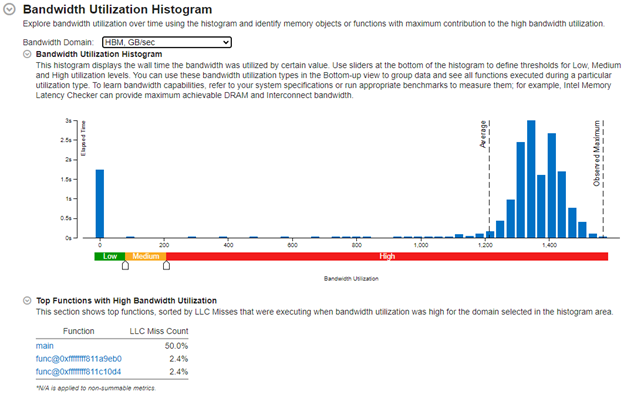
In this example, there is a high utilization of HBM with over 1200 GB/sec for the majority of the duration. This is because the STREAM benchmark is designed to maximize the use of memory bandwidth.
Finally, switch to the Bottom-up window to observe the timeline. Here, you can examine the following bandwidths over time:
- DRAM bandwidth (broken down per channel)
- HBM bandwidth (broken down per package)
- Intel® UPI links (broken down per link)
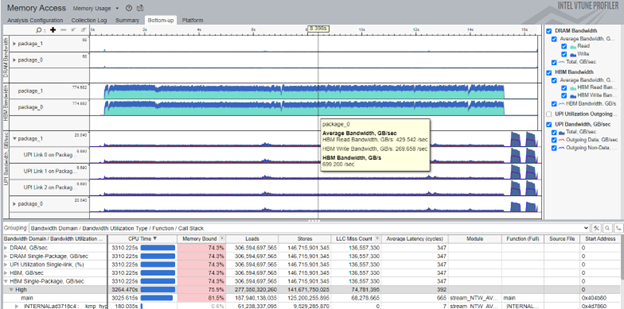
Use this information to identify potential issues like misconfiguration which can lead to unnecessary UPI or DRAM bandwidth.
Hover your mouse on the graph to analyze specific parts and see the bandwidth at the selected instant of time.
In the Grouping pane, select the Bandwidth Domain / Bandwidth Utilization / Type / Function / Call Stack grouping. Use this grouping to identify functions with high utilization in the HBM bandwidth domain.
To further optimize the performance of your application, run these analyses:
Follow these analysis procedures to identify other performance issues.This recipe describes how you measure performance when running the STREAM application in HBM Flat mode. To compare performance in the HBM Caching and HBM Only modes, switch the HBM mode and repeat the performance analysis. Find the mode with the shortest elapsed time. You can also compare DRAM and HBM bandwidths to look for higher overall bandwidth.

