A newer version of this document is available. Customers should click here to go to the newest version.
Visible to Intel only — GUID: GUID-58135E00-01AD-4D19-9026-7F9ECFF257FD
Visible to Intel only — GUID: GUID-58135E00-01AD-4D19-9026-7F9ECFF257FD
Profiling JavaScript* Code in Node.js*
This recipe provides configuration steps to rebuild Node.js* and run a performance analysis of your JavaScript code using Intel® VTune™ Profiler. This analysis includes mixed-mode call stacks that contain JS frames and native frames.
Content Expert: Alexey Kireev
Ingredients
This section lists the hardware and software tools used for the performance analysis scenario.
Application: sample.js. This application is used as a demo. It is not available for download.
JavaScript environment: Node.js version 20.4.0 with Chrome* V8 version11.3.244.8
Performance analysis tools:Intel® VTune™ Profiler version 2023.1 - Advanced Hotspots analysis with User-Mode Sampling
NOTE:Starting with the 2020 release, Intel® VTune™ Amplifier has been renamed to Intel® VTune™ Profiler.
Most recipes in the Intel® VTune™ Profiler Performance Analysis Cookbook are flexible. You can apply them to different versions of Intel® VTune™ Profiler. In some cases, minor adjustments may be required.
Get the latest version of Intel® VTune™ Profiler:
From the Intel® VTune™ Profiler product page.
Download the latest standalone package from the Intel® oneAPI standalone components page.
Operating system: Windows* 10
Enable Support for VTune Profiler in Node.js
Download the most recent node.js sources.
Run the vcbuild.bat script from the root node-v20.4.0 folder:
vcbuild.bat enable-vtuneThis script builds Node.js with support for VTune Profiler to profile JavaScript code.
Profile JavaScript Code Running in Node.js
This recipe uses a sample JavaScript application:
function say(word) {
console.log("Calculating ...");
var res = 1;
for (var i = 0; i < 40000; i++) {
  for (var j = 0; j < 40000; j++) {
    res = ( res + i * res - j )/ 2;
  }
}
console.log("Done.");
console.log(word);
}

function execute(someFunction, value) {
  someFunction(value);
}

execute(say, "Hello from Node.js!");
Run VTune Profiler from the command line:
vtune-gui.exeClick the New Project icon in the toolbar to create a new project.
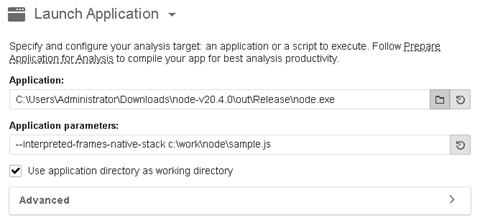
In the Launch Application section,
Specify node.exe in the Application field
Set sample.js in the Application parameters field.
To translate frames interpreted by JavaScript, set --interpreted-frames-native-stack as an option in the Application parameters field.

In the Analysis Type pane, select the Hotspots analysis type.
Click Start to run the analysis.
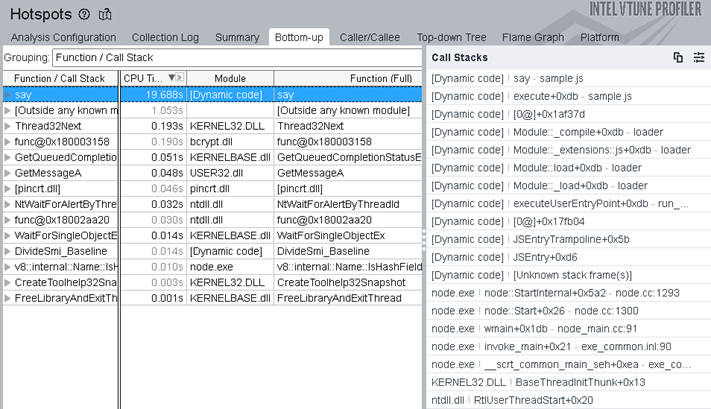
Once the analysis finishes, see results in the Summary window. We can see that the say function took the most CPU time to execute. Click on this function and switch to the Bottom-up view. See the stack flow for the hotspot:

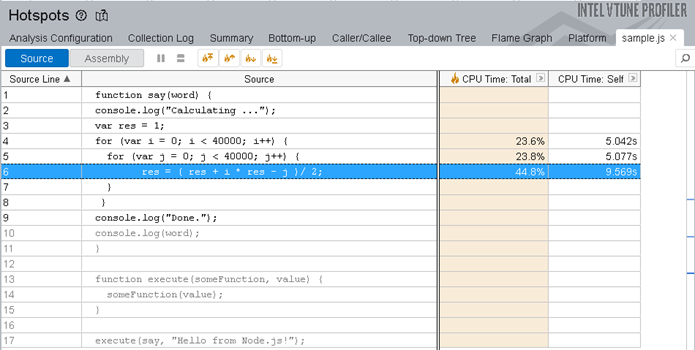
Doubleclick on the say function to run a source level analysis.
