A newer version of this document is available. Customers should click here to go to the newest version.
Profiling OpenVINO™ Applications (NEW)
Learn how to use Intel® VTune™ Profiler to profile AI applications. This recipe uses a benchmark application in the OpenVINO™ toolkit.
Content Expert: Kali Uday Balleda, Kumar Sanatan
DIRECTIONS:
Set up OpenVINO™.
Build the OpenVINO™ source.
Configure OpenVINO™ for Performance Analysis.
Profile CPU Hot Spots.
Profile GPU Hot Spots.
Profile NPUs.
Ingredients
Here are the hardware and software tools you need for this recipe.
Applications and Toolkits:
- If your OpenVINO application requires the use of Intel® oneAPI Deep Neural Network Library (oneDNN) or Intel® oneAPI Data Analytics Library (oneDAL), download the Intel® oneAPI Base Toolkit for Windows* (version 2024.1 or newer).
- Intel® NPU Driver - Windows*(version 32.0.100.2381)
- Benchmark Tool application. Get this application with the 2024.1 (or a newer) version of the OpenVINO™ toolkit. The toolkit contains Python and C++ versions of benchmark_app.
- Intel® Distribution for Python* (version 2024.1)
- CMake version 3.29.2 for Microsoft Windows*
- Microsoft Visual Studio 2022 Community Edition (17.9.6)
- Git for Windows
Analysis Tool:VTune Profiler (version 2024.1 or newer)
CPU: Intel® Core Ultra 7 Processor 165H (code named Meteor Lake)
Set up OpenVINO™
To set up OpenVINO™ from the package manager, install these applications in sequence:
- If you use oneDNN or oneDAL libraries, install the Intel® oneAPI Base Toolkit. Follow these instructions.
- Next, install Intel® Distribution for Python* (Intel Python3).
- Set up CMake.
- Next, set up Microsoft Visual Studio 2022.
- Install Git for Windows.
- At the command prompt, set the path to Intel Python3. In the folder where you downloaded Intel Distribution for Python, run vars.bat from the env subdirectory.
Build the OpenVINO™ source
- In Github, clone the OpenVINO repository:
git clone https://github.com/OpenVINOtoolkit/OpenVINO.git
- Open the OpenVINO folder:
cd OpenVINO
- Update the submodule:
git submodule update –init
- Create a build directory:
mkdir build
- Open the build directory:
cd build
- Generate a Microsoft Visual Studio project with the OpenVINO source code. Make sure to enable the OpenVINO runtime with Python API. Also enable the ability to profile with the Instrumentation and Tracing Technology (ITT) API.
cmake -G “Visual Studio 17 2022” <path\to\OpenVINO™ source code> -DCMAKE_BUILD_TYPE=Release
-DENABLE_PYTHON=ON  -DPython3_EXECUTABLE= "C:\Users\sdp\Downloads\intelpython3\python.exe"
-DENABLE_PROFILING_ITT=ON
- Open the OpenVINO™.sln solution in Microsoft Visual Studio 2022.
- Build the solution file in release mode.
When the build is successful, you find a new bin directory that contains:
- Python libraries in bin\intel64\Release\python
- OpenVINO™ Plugins and DLLs in bin\int64\Release\
Configure OpenVINO™ for Performance Analysis
Before you run performance analyses on AI applications, make sure to configure OpenVINO™ first:
- Configure the OpenVINO™ build with the Instrumentation and Tracing Technology API (ITT API). Set these environment variables:
set PYTHONPATH=<path to OpenVINO™ repository>\bin\intel64\Release\python;%PYTHONPATH%
set OpenVINO™_LIB_PATHS=<path to OpenVINO™ repository>\bin\intel64\Release;%OpenVINO™_LIB_PATH%
- Run the setup script for Python:
C:\Users\sdp\intelpython3\env\vars.bat
- Run the setup script for oneAPI tools:
C:\Program Files (x86)\Intel\<toolkit_version>\oneAPI-vars.bat
Before you run an AI application on an Intel processor, you must convert the AI model into the OpenVINO™ IR format. To learn more about this conversion, use the omz_converter tool.
You can run the profiling analyses described here on any AI application of your choice. This recipe uses the Benchmark tool (available in the OpenVINO™ toolkit) to demonstrate how you run analyses with VTune Profiler. Use benchmark_app to calculate the throughput and run a latency analysis for your AI application.
To run benchmark_app, at the command prompt, type this command:
benchmark_app -m model.xml -d NPU -niter 1000
where:
model.xml is your AI application
d is the target device (CPU/GPU/NPU)
niter is the number of iterations
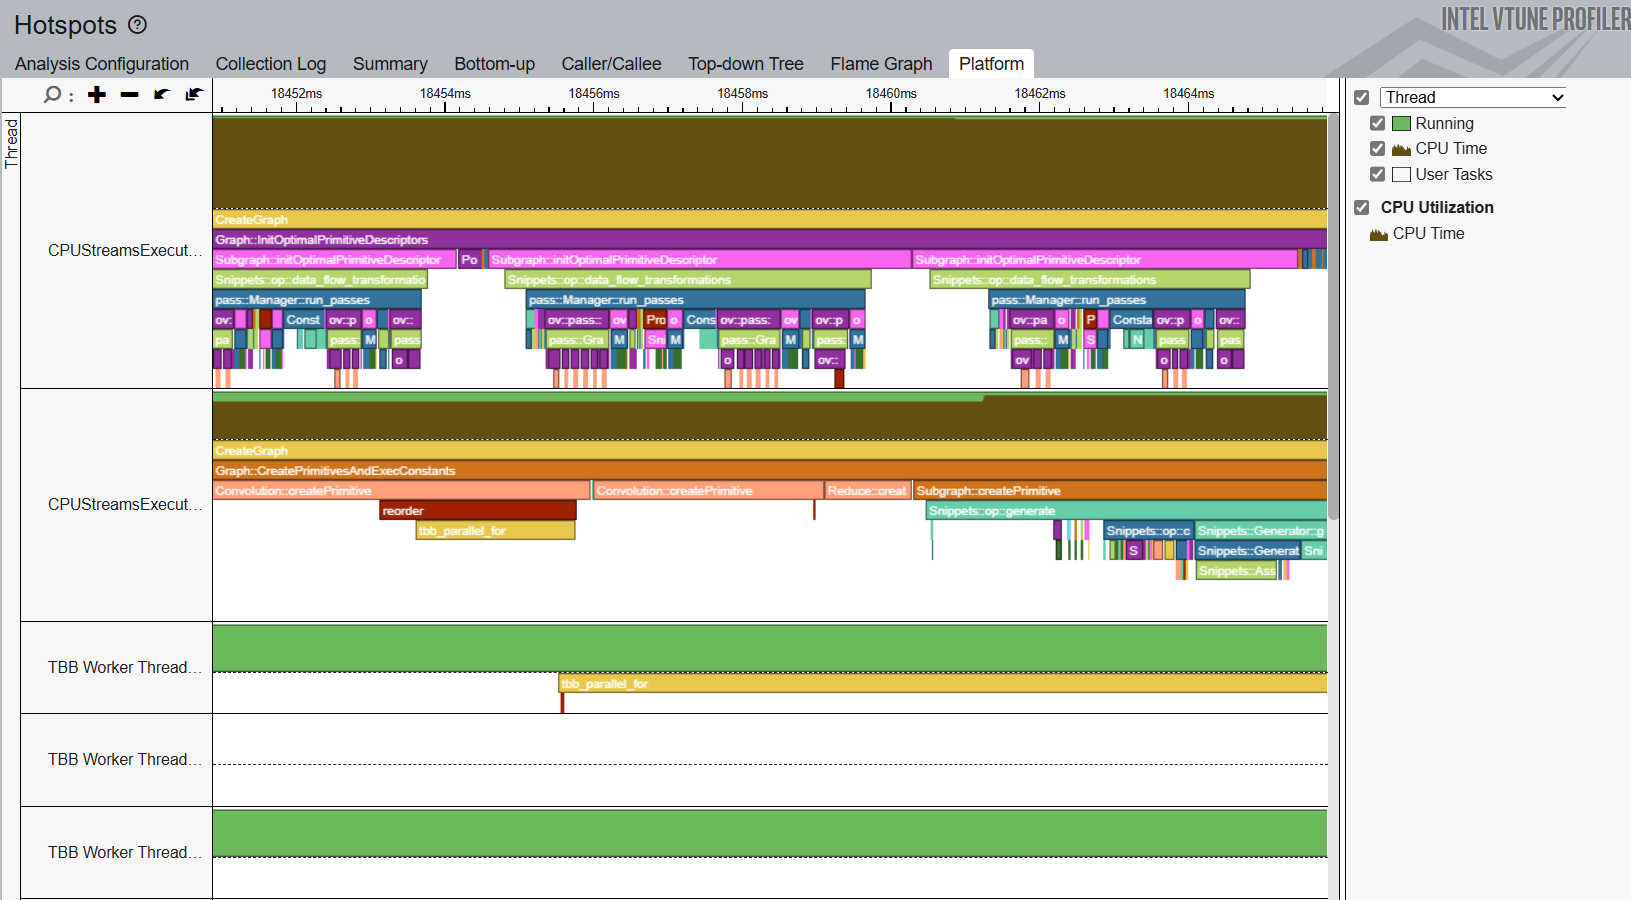
Profile CPU Hot Spots
To identify CPU bottlenecks, run the Hotspots analysis . In the command window, type:
vtune -c hotspots -r <path to VTune results directory> -- benchmark_app -m model.xml -d CPU -niter 1000
Open the result of the analysis and identify CPU hot spots in the Bottom-up and Platform windows.

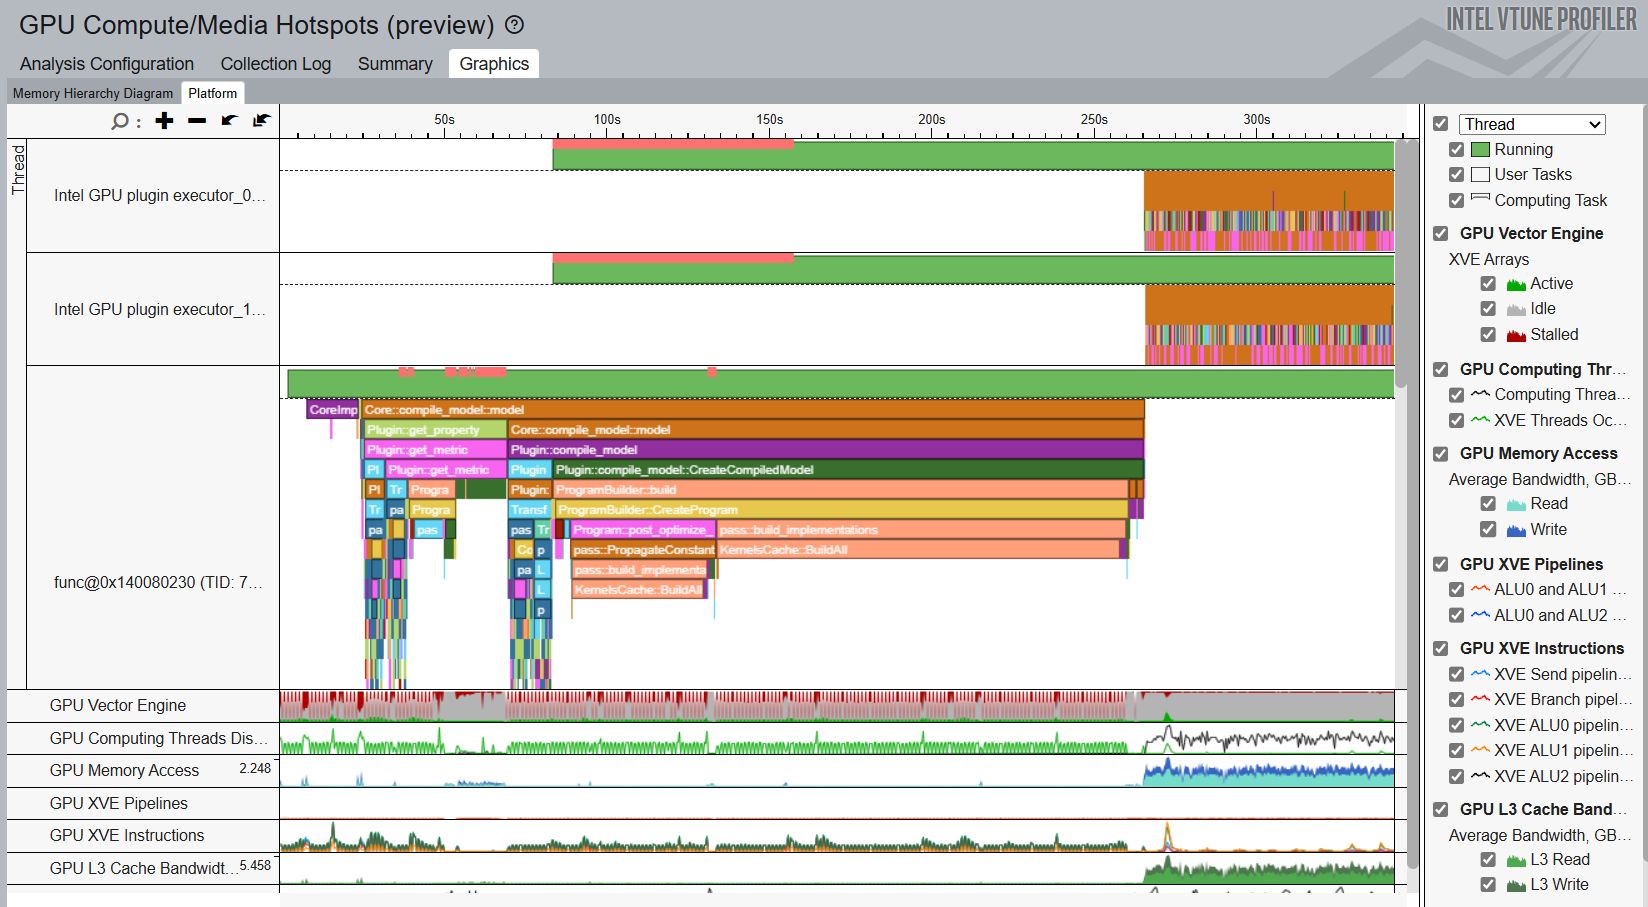
Profile GPU Hot Spots
To identify GPU bottlenecks, run the GPU Compute/Media Hotspots analysis . In the command window, type:
vtune -c gpu-hotspots -r <path to VTune results directory> -- benchmark_app -m model.xml -d GPU -niter 1000
Open the result of the analysis and identify GPU hot spots in the Graphics window.

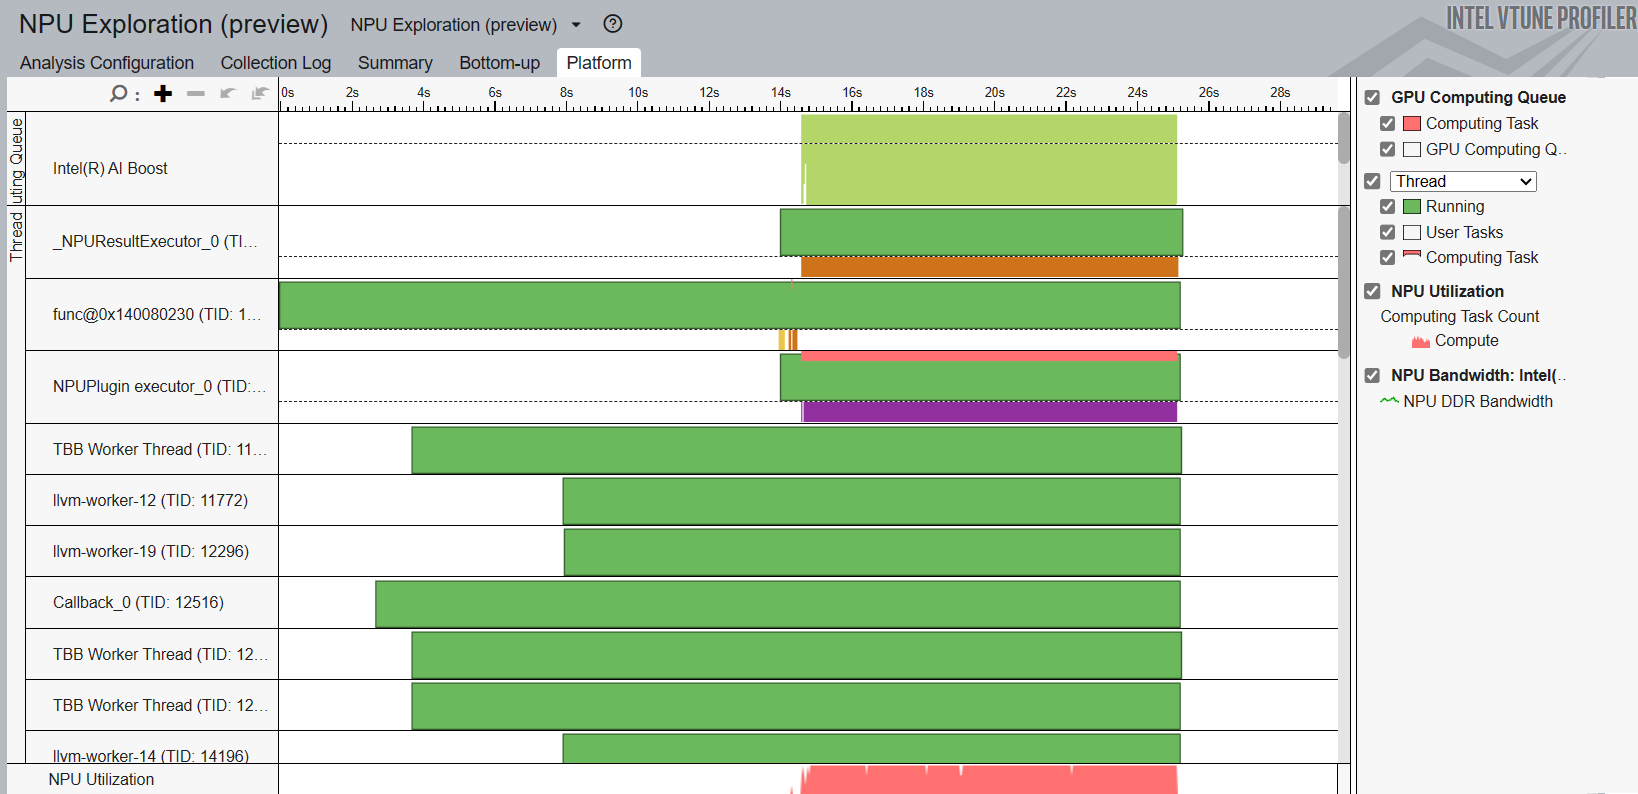
Profile NPUs
To profile NPUs, run the NPU Exploration analysis . In the command window, type:
vtune -c npu -r <path to VTune results directory> -- benchmark_app -m model.xml -d npu -niter 1000
Open the result of the analysis and understand NPU usage in the Platform window.
