Profiling a SYCL* Application running on a GPU
Learn how to use Intel® VTune™ Profiler to analyze a SYCL application that has been offloaded onto a GPU.
Content expert: Cory Levels
Ingredients
Here are the minimum hardware and software requirements for this performance analysis.
Application: matrix_multiply_vtune. This sample application is available as part of the code sample package for Intel® oneAPI toolkits.
Compiler: To profile a SYCL application, you need the Intel® oneAPI DPC++/C++ Compiler that is available with Intel oneAPI toolkits.
Tools: Intel® VTune™ Profiler - GPU Offload and GPU Compute/Media Hotspots Analyses.
Microarchitecture:
Intel Processor Graphics Gen 9 or newer
Intel microarchitectures code named Kaby Lake, Coffee Lake, or Ice Lake
Operating system:
Linux* OS, kernel version 4.14 or newer.
Windows* 10 OS.
Graphical User Interface for Linux:
- GTK+ (2.10 or higher. ideally, use 2.18 or higher)
- Pango (1.14 or higher)
- X.Org (1.0 or higher, ideally use 1.7 or higher)
Build and Compile a SYCL Application
On Linux OS:
Go to the sample directory.
cd <sample_dir>/VtuneProfiler/matrix_multiply_vtune
The multiply.cpp file in the src directory contains several versions of matrix multiplication. Select a version by editing the corresponding #define MULTIPLY line in multiply.hpp.
Compile your sample application:
cmake .
make
This generates a matrix.dpcpp -fsycl executable.
To delete the program, type:
make clean
This removes the executable and object files that were created by the make command.
On Windows OS:
Open the sample directory:
<sample_dir>\VtuneProfiler\matrix_multiply_vtune
In this directory, open a Visual Studio* project file named matrix_multiply.sln
The multiply.cpp file contains several versions of matrix multiplication. Select a version by editing the corresponding #define MULTIPLY line in multiply.hpp
Build the entire project with a Release configuration.
This generates an executable called matrix_multiply.exe.
Run GPU Offload Analysis on a SYCL Application
Prerequisites: Prepare the system to run a GPU analysis. See Set Up System for GPU Analysis.
Launch VTune Profiler and click New Project from the Welcome page.
The Create a Project dialog box opens.
Specify a project name and a location for your project and click Create Project.
The Configure Analysis window opens.
Make sure the Local Host is selected in the WHERE pane.
In the WHAT pane, make sure the Launch Application target is selected and specify the matrix_multiply binary as an Application to profile.
In the HOW pane, select GPU Offload analysis type from the Accelerators group.
This is the least intrusive analysis for applications running on platforms with Intel Graphics as well as on other third-party GPUs supported by VTune Profiler.
Click the Start button to launch the analysis.
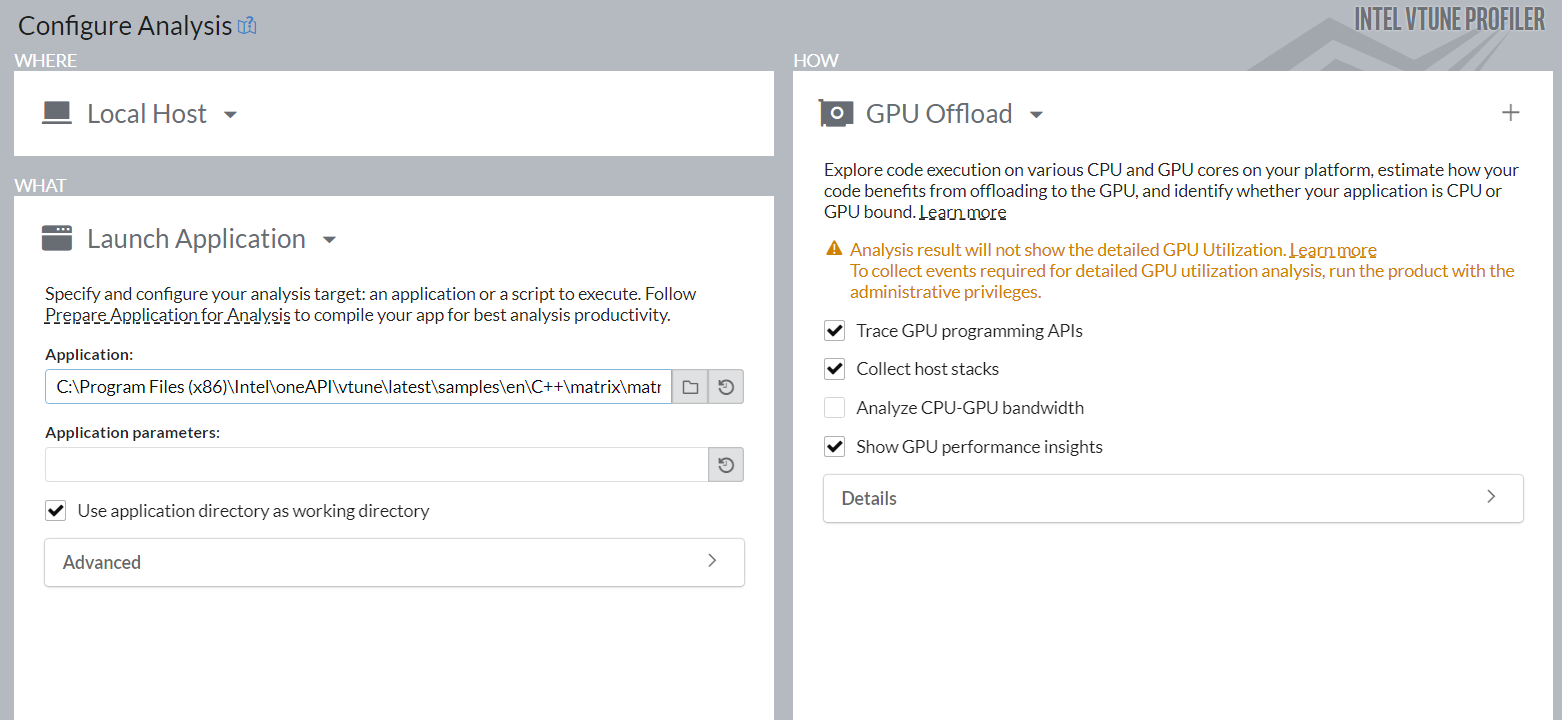
Run Analysis from Command Line:
To run the analysis from the command line:
On Linux OS:
Set VTune Profiler environment variables by exporting the script:
export <install_dir>/env/vars.sh
Run the analysis:
vtune -collect gpu-offload - ./matrix.dpcpp -fsycl
On Windows OS:
Set VTune Profiler environment variables by running the batch file:
export <install_dir>\env\vars.bat
Run the analysis command:
vtune.exe -collect gpu-offload -- matrix_multiply.exe
Analyze Collected Data
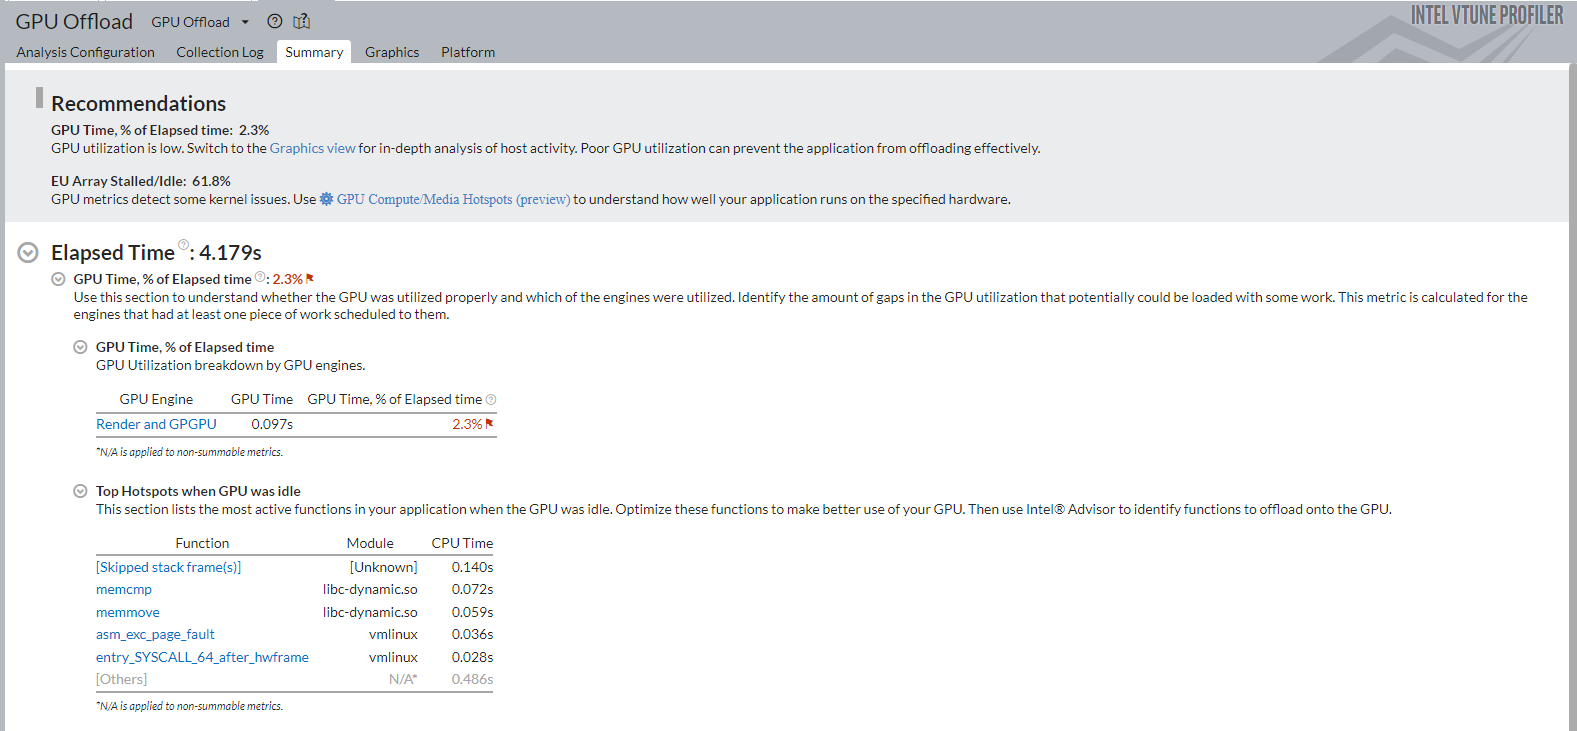
Start your analysis with the GPU Offload viewpoint. In the Summary window, see statistics on CPU and GPU resource usage to determine if your application is GPU-bound, CPU-bound, or not effectively utilizing the compute capabilities of the system. In this example, the application should use the GPU for intensive computation. However, the result summary informs that GPU usage is actually low.
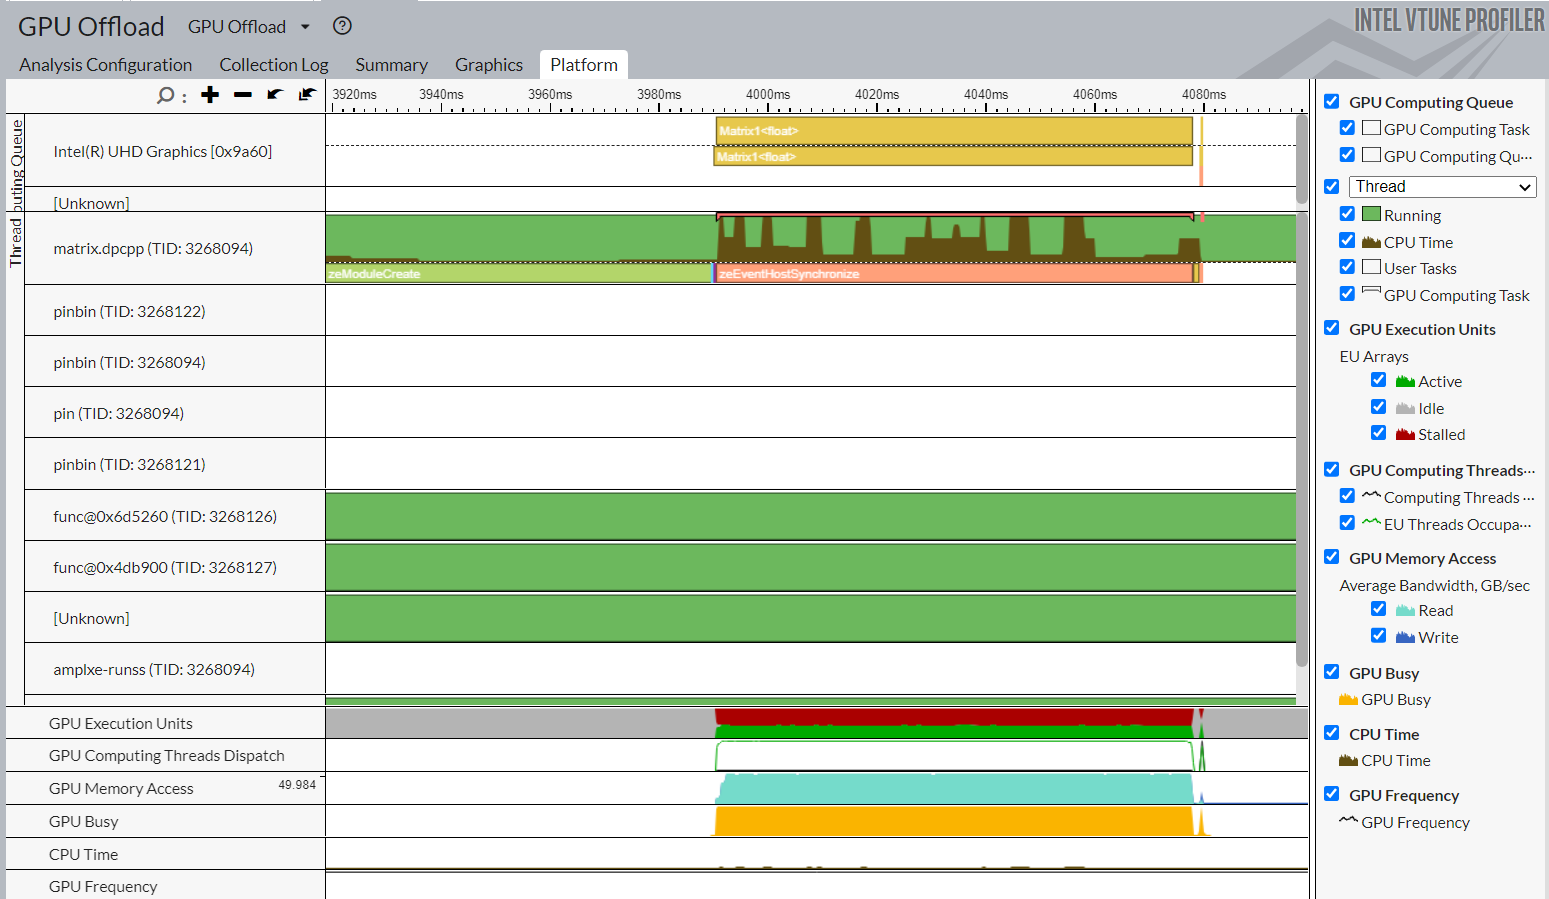
Switch to the Platform window. Here, you can see basic CPU and GPU metrics that help analyze GPU usage on a software queue. This data is correlated with CPU usage on the timeline. The information in the Platform window can help you make some inferences.
GPU Bound Applications |
CPU Bound Applications |
|---|---|
The GPU is busy for a majority of the profiling time. |
The CPU is busy for a majority of the profiling time. |
There are small idle gaps between busy intervals. |
There are large idle gaps between busy intervals. |
The GPU software queue is rarely reduced to zero. |
Most applications may not present obvious situations as described above. A detailed analysis is important to understand all dependencies. For example, GPU engines that are responsible for video processing and rendering are loaded in turns. In this case, they are used in a serial manner. When the application code runs on the CPU, this can cause an ineffective scheduling on the GPU. The behavior can mislead you to interpret the application to be GPU bound.
Identify the GPU execution phase based on the computing task reference and GPU Utilization metrics. Then, you can define the overhead for creating the task and placing it into a queue.
To investigate a computing task, switch to the Graphics window to examine the type of work (rendering or computation) running on the GPU per thread. Select the Computing Task grouping and use the table to study the performance characterization of your task.
To further analyze your computing task, run the GPU Compute/Media Hotspots analysis type.

Use the README file in the sample to profile other implementations of multiply.cpp.
Run GPU Compute/Media Hotspots Analysis
Prerequisites: If you have not already done so, prepare the system to run a GPU analysis. See Set Up System for GPU Analysis.
To run the analysis:
In the Accelerators group, select the GPU Compute/Media Hotspots analysis type.
Configure analysis options as described in the previous section.
Click the Start button to run the analysis.

Run Analysis from Command Line
To run the analysis from the command line:
On Linux OS:
vtune -collect gpu-hotspots – ./matrix.dpcpp -fsycl
On Windows OS:
vtune.exe -collect gpu-hotspots -- matrix_multiply.exe
Analyze Your Compute Task
The default analysis configuration invokes the Characterization profile with the Overview metric set. In addition to individual compute task characterization that is available through the GPU Offload analysis, VTune Profiler provides memory bandwidth metrics that are categorized by different levels of GPU memory hierarchy.

For a visual representation of the memory hierarchy, see the Memory Hierarchy Diagram. This diagram reflects the microarchitecture of the current GPU and shows memory bandwidth metrics. Use the diagram to understand the data traffic between memory units and execution units. You can also identify potential bottlenecks that cause EU stalls. For example, in the diagram below, you see that the L3 bandwidth and stalled EUs have both been flagged as potential issues to investigate.
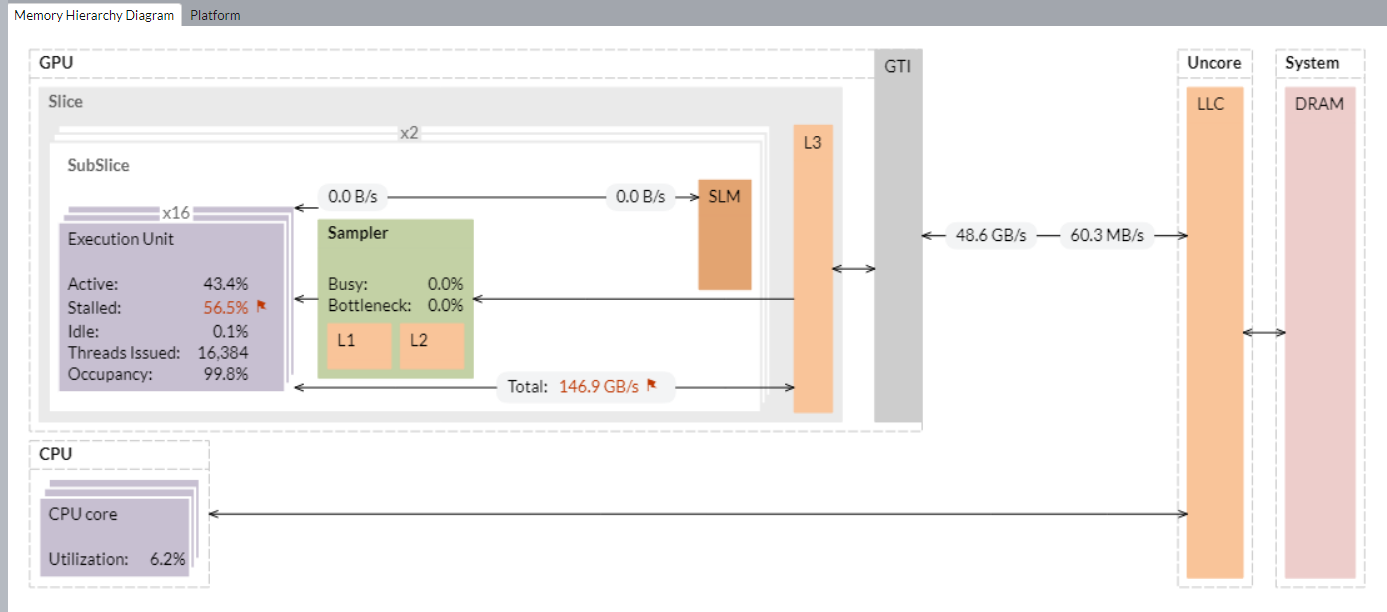
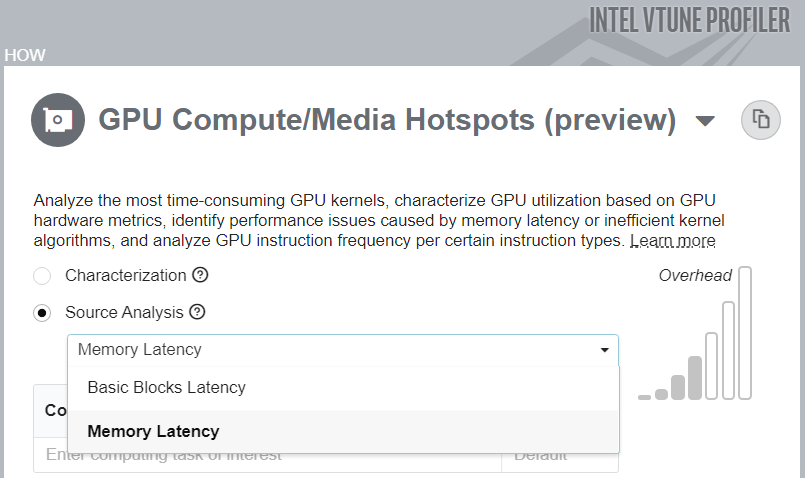
You can also analyze compute tasks at the source code level. For example, to count GPU clock cycles spent on a particular task or due to memory latency, use the Source Analysis option.
Discuss this recipe in the VTune Profiler developer forum.