OpenMP* Imbalance and Scheduling Overhead
Follow this recipe to detect and fix frequent parallel bottlenecks of OpenMP programs, such as imbalance on barriers and scheduling overhead.
A barrier is a synchronization point when execution is allowed after all threads in the thread team have arrived. If the execution work is irregular and the chunks of work are equally and statically distributed by worker threads, then the threads that already arrived at the barrier have to now wait for the remaining threads. This is wasted time. When the aggregated wait time on a barrier is normalized by the number of threads in the team, you get the elapsed time that the application can reduce, if the imbalance is eliminated.
One way to eliminate the imbalance on a barrier is to use dynamic scheduling to have chunks of work distributed dynamically between threads. However, following this method with fine-grain chunks can worsen the situation due to scheduling overhead. This recipe describes how you can address OpenMP load imbalance and scheduling overhead problems.
Content Expert: Rupak Roy
Ingredients
This section lists the hardware and software tools you may need for this recipe.
Application: The sample application used in this recipe calculates prime numbers in a particular range. The main loop is parallelized with the OpenMP parallel for construct.
Compiler: Intel® oneAPI DPC++/C++ Compiler version 2023.1 or newer. An appropriate version of the Intel Compiler is necessary to have instrumentation inside the Intel OpenMP runtime library, which Intel® VTune™ Profiler uses for analysis. The parallel-source-info=2 compiler option provides source file information in the OpenMP region names, which helps to identify them.
Performance analysis tools:
VTune Profiler version 2023.1 or newer: HPC Performance Characterization analysis
Operating system: Linux*, CentOS Stream release 8
CPU: Intel® Xeon® Gold 6148 CPU @ 2.40GHz
Create a Baseline
The initial version of the sample code uses the OpenMP parallel for pragma for the loop by numbers, with the default scheduling that implies static (line 21):
Running the compiled application in this case takes about 3.9 seconds. This is a performance baseline that we will use for further optimizations.
Run HPC Performance Characterization Analysis
To get a high-level understanding of potential performance bottlenecks for the sample, start with the HPC Performance Characterization analysis:
Click the
 New Project button on the toolbar and specify a name for the new project, for example: primes.
 Click Create Project.
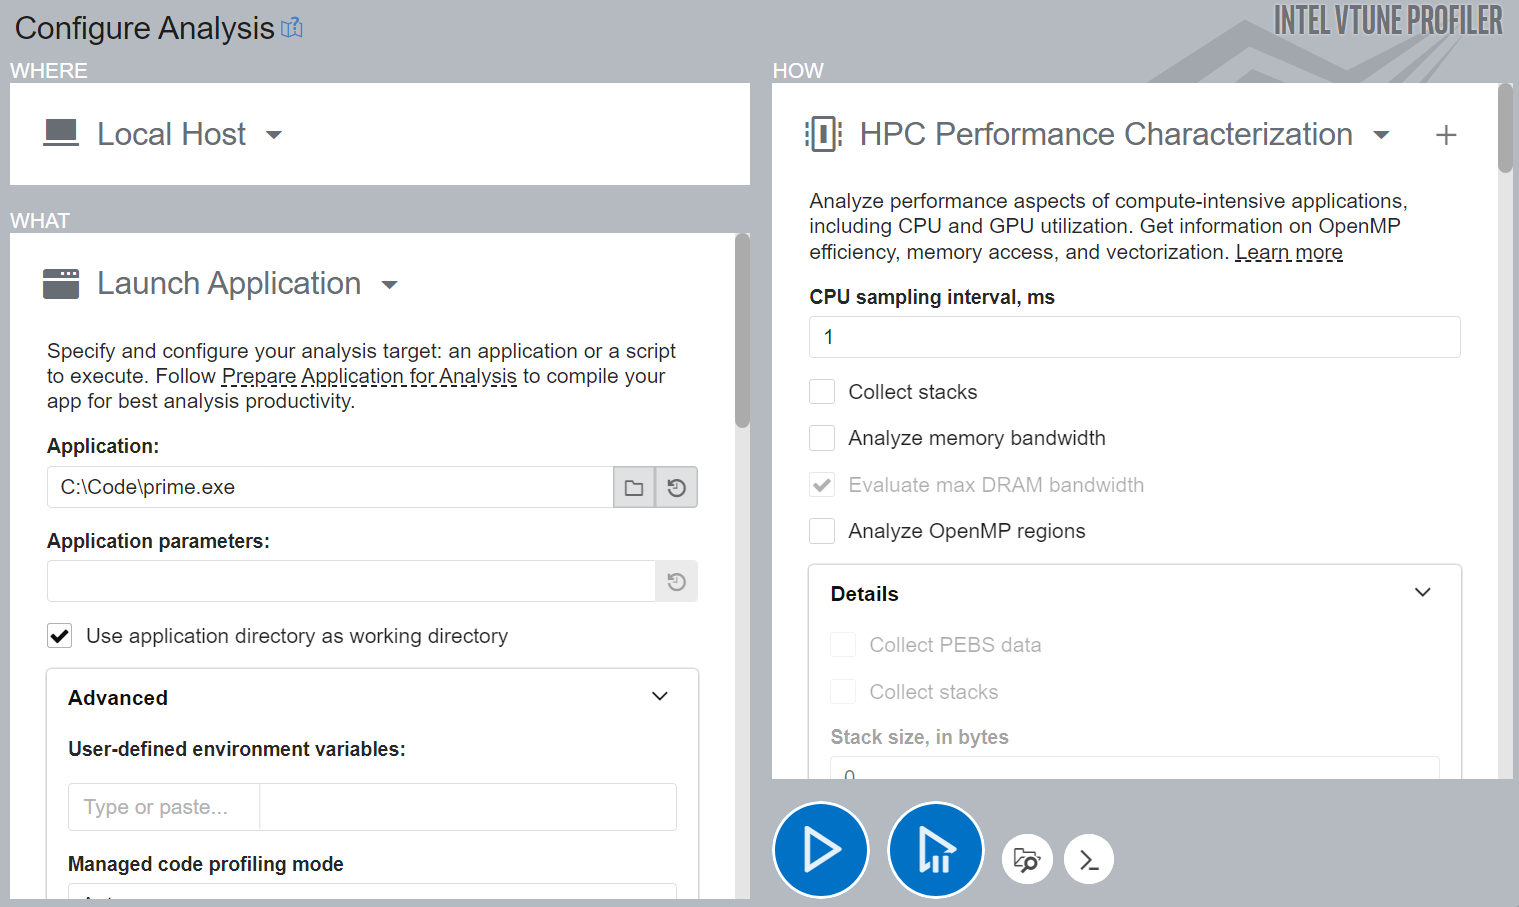
The Configure Analysis window opens.
On the WHERE pane, select the Local Host target system type.
On the WHAT pane, select the Launch Application target type and specify an application for analysis. For example:

In the HOW pane, in the Analysis Tree, select HPC Performance Characterization in the Parallelism group.
Click the
 Start button.
VTune Profiler runs the application, collects data, and finalizes the data collection result (resolving symbol information which is required for successful source analysis).
Identify OpenMP Imbalance
When the HPC Performance Characterization analysis completes, the Summary window shows important HPC metrics that help understand performance bottlenecks like CPU utilization (parallelism), memory access efficiency, and vectorization. For applications that run with the Intel OpenMP runtime, you can benefit from special OpenMP efficiency metrics that help identify issues with threading parallelism.
Start your analysis by reviewing application-level statistics in the VTune Profiler. If the Effective Physical Core Utilization metric (on some systems just CPU Utilization) is flagged, a performance problem exists that you should investigate.

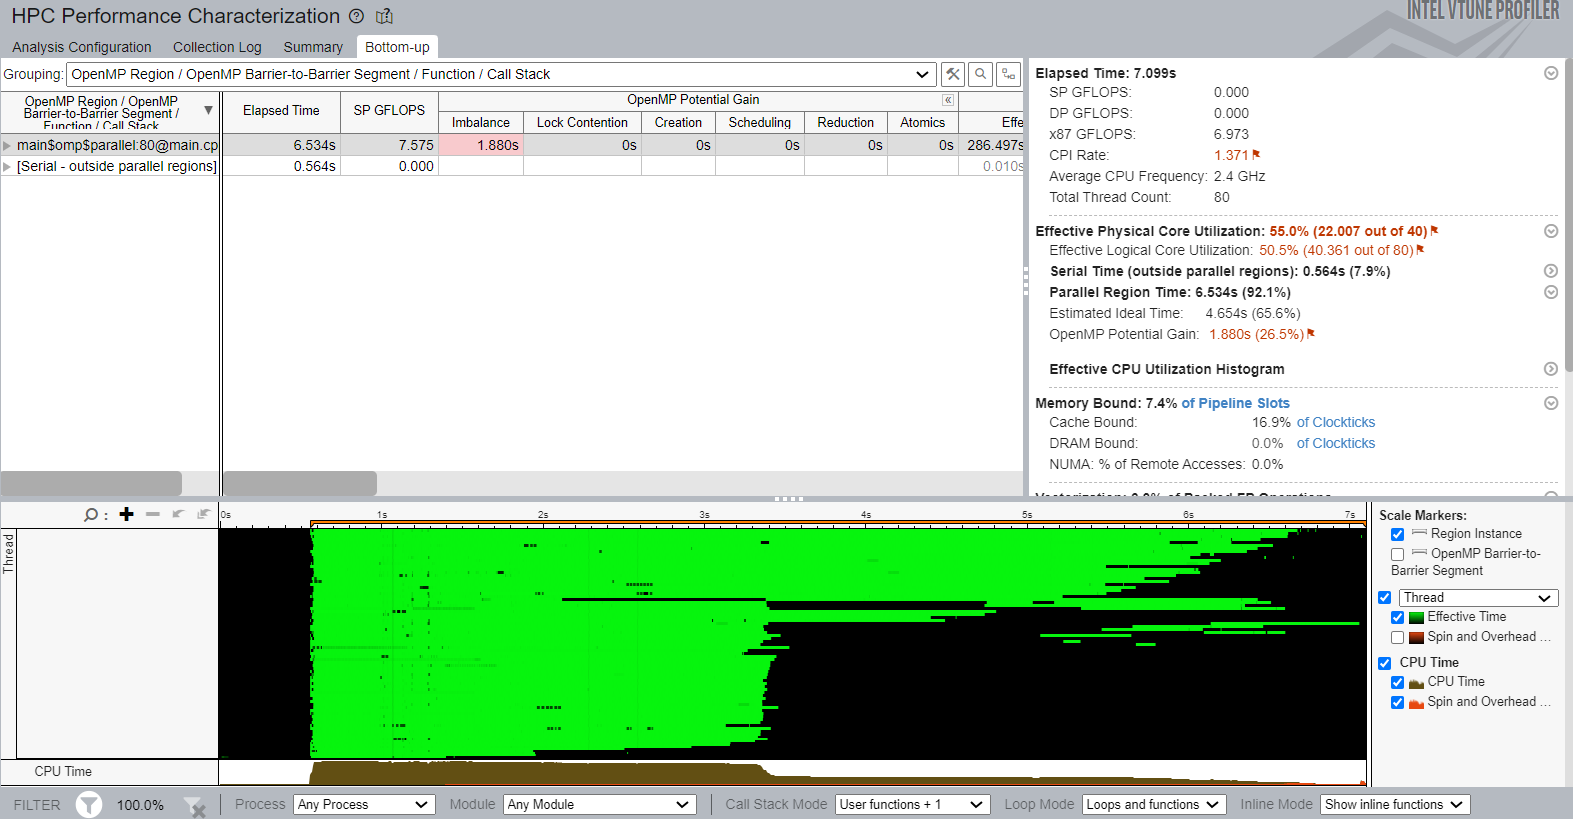
In the Parallel Region Time section, see the OpenMP Potential Gain metric. Use this to estimate the maximum potential gain that you can get by eliminating parallel inefficiencies. In the sample application, the potential gain is 1.880s (equal to 26.5% of the application runtime). This metric is flagged in the example, so it may be worthwhile to explore the breakdown by parallel constructs.
In the sample application, there is one parallel construct provided in the Top OpenMP Regions section. Click the region name in the table to explore more details in the Bottom-up view. To see the breakdown by inefficiencies, expand the OpenMP Potential Gain column in the Bottom-up grid. This data helps you understand why the processor time was spent on the OpenMP runtime rather than the sample application. You can also understand how it impacts the elapsed time:

The hot region in the grid row has a value highlighted for the Imbalance metric. Hover your mouse over this value to see a recommendatiion to try dynamic scheduling to eliminate the imbalance. If you have more than one barrier in a region, you must expand the region node by barrier-to-barrier segments and identify a performance-critical barrier:

In this sample, there is a loop barrier with critical imbalance and a parallel region join barrier that is not classified by VTune Profiler as a bottleneck.
To better visualize the imbalance during the application run, see the Timeline view. The green sections indicate useful work while the black sections show code segments where time was wasted.
Apply Dynamic Scheduling
The imbalance could be caused by static work distribution and assigning large numbers to particular threads while some of the threads processed their chunks with small numbers quickly and wasted the time on the barrier. To eliminate this imbalance, apply dynamic scheduling with the default parameters:
Recompile the application and compare the execution time versus the original performance baseline to verify your optimization.
Identify OpenMP Scheduling Overhead
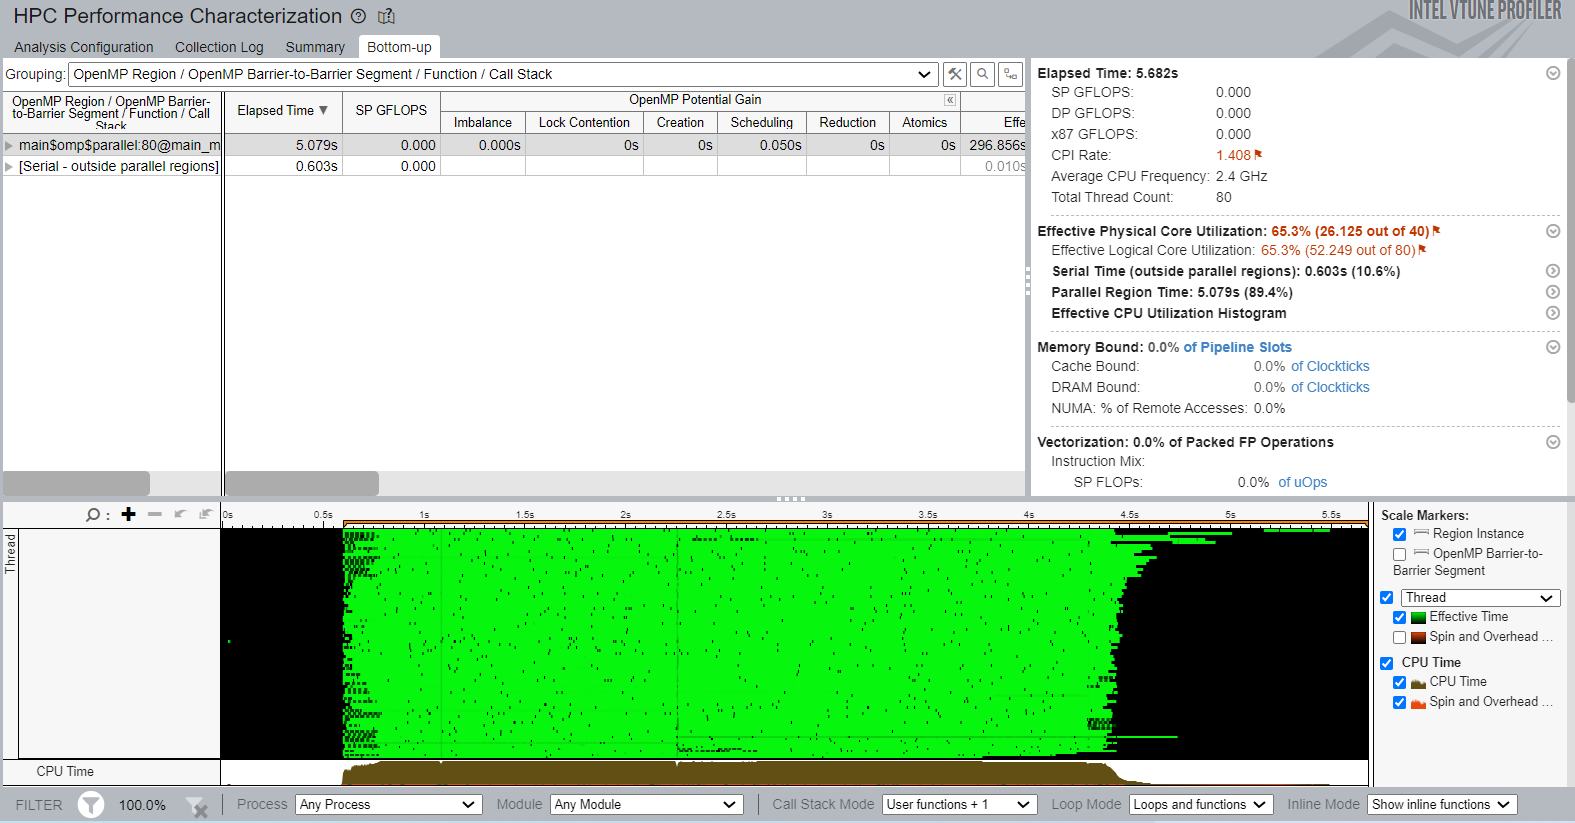
Running the modified sample application does not result in any speedup but we can see that the execution time has increased to 5.3 seconds. This is a possible side effect of applying dynamic scheduling with fine-grain chunks of work. To get more insights on possible bottlenecks, repeat the HPC Performance Characterization analysis on the modified code to see the reasons for performance degradation.
After repeating the analysis, open the Bottom-up view:

We can observe that the Imbalance Overhead has come down to zero. However, the Scheduling overhead has jumped to 0.05s. This is caused by the default behavior of the scheduler that assigns one loop iteration per worker thread. Dynamic Scheduling has additional scheduling overhead because threads turn back to the scheduler very frequently during runtime, thus creating a bottleneck. If the scheduling time is significant, try using chunks of coarse-grain work.
Apply Dynamic Scheduling with a Chunk Parameter
Use the chunk parameter 20 for the schedule clause as follows:
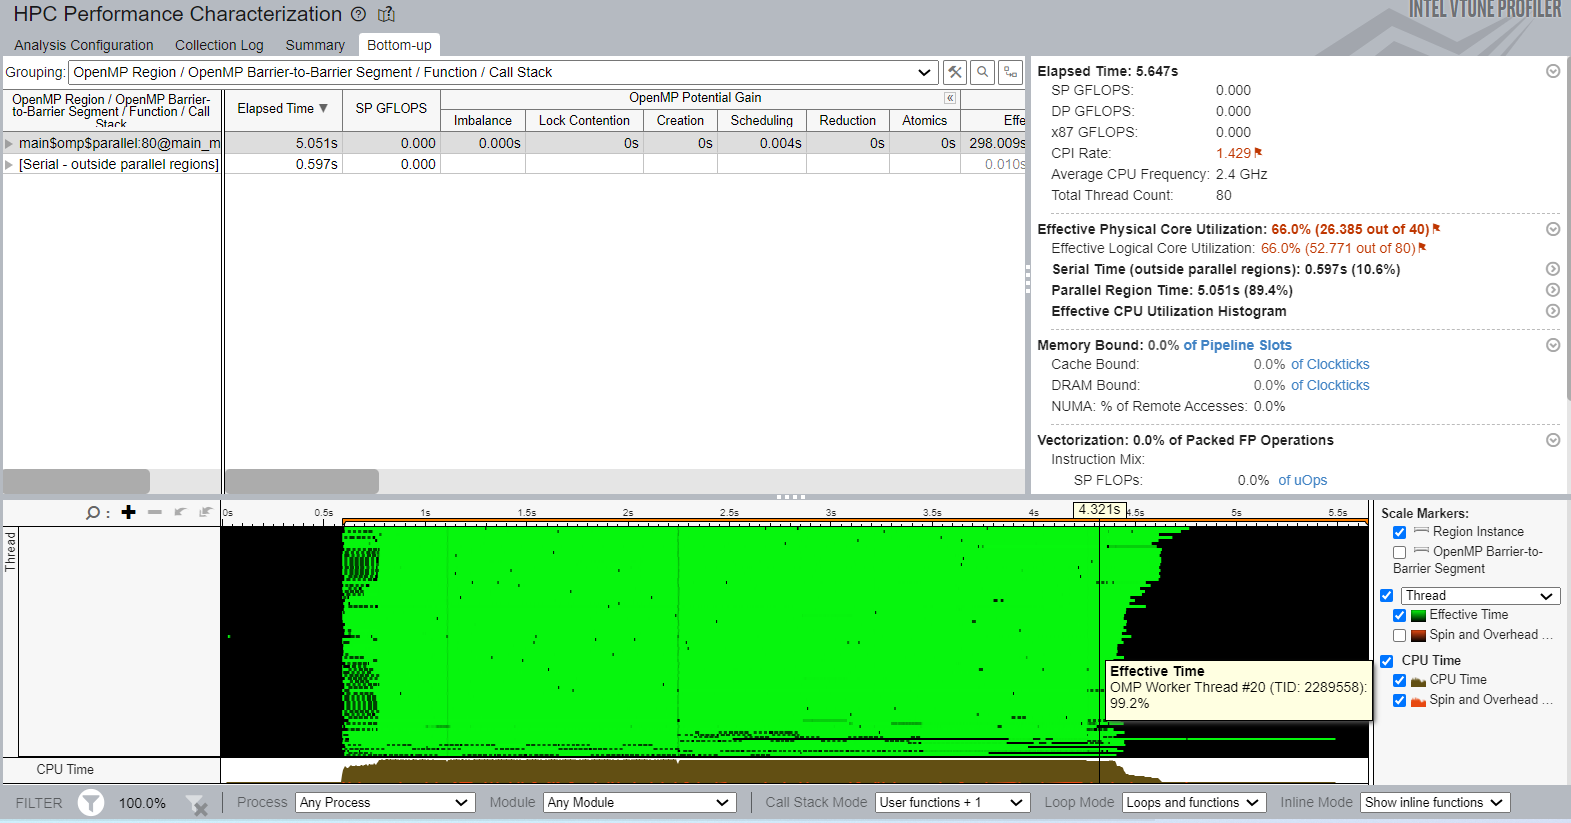
After compiling the application again, the elapsed runtime was 5.647 seconds. The physical core utilization improved from 55% to 66%. The Summary view shows the Parallel Region Time as 89.4%:

The Bottom-up view shows a good density of useful work (highlighted in green) on the timeline:

Dynamic scheduling may cause code execution that is not cache-friendly. This is because frequent assignments of new chunks of work to a thread can prevent the thread from reusing the cache effectively. So, a well-balanced optimized application with effective CPU utilization can run slower than an imbalanced one with static scheduling. If you observe this behavior, see the Memory Bound section of the HPC Performance Characterization view for more information.
You can discuss this recipe in the Analyzers developer forum.