GDB GPU Support for Intel® oneAPI Toolkits
Using Visual Studio Code* with Intel® oneAPI Toolkits
Prepare Launch Configuration
This extension for Visual Studio Code (VS Code) enables additional features of GPU debugging with the GDB for Intel® oneAPI toolkits. Start using this VS Code extension with guide Get Started with Intel® Distribution for GDB* on Linux* OS Host.
Note that this feature is only available for the Linux* target platform.
Open your project in VS Code.
Build your project with the -g and -O0 options to prepare for debugging.
Press Ctrl+Shift+P ( or View -> Command Palette… ) to open the Command Palette.
Type Intel oneAPI to view options of the installed extensions.
Click on Intel oneAPI: Generate launch configurations.

Follow the prompts to add launch configurations. First, select the executable:

Select yes, to automatically break on main.

Answer the prompt to set arguments to be passed to the application to debug. In the example below, an argument named gpu will be passed on the command line when the application being debugged is launched.

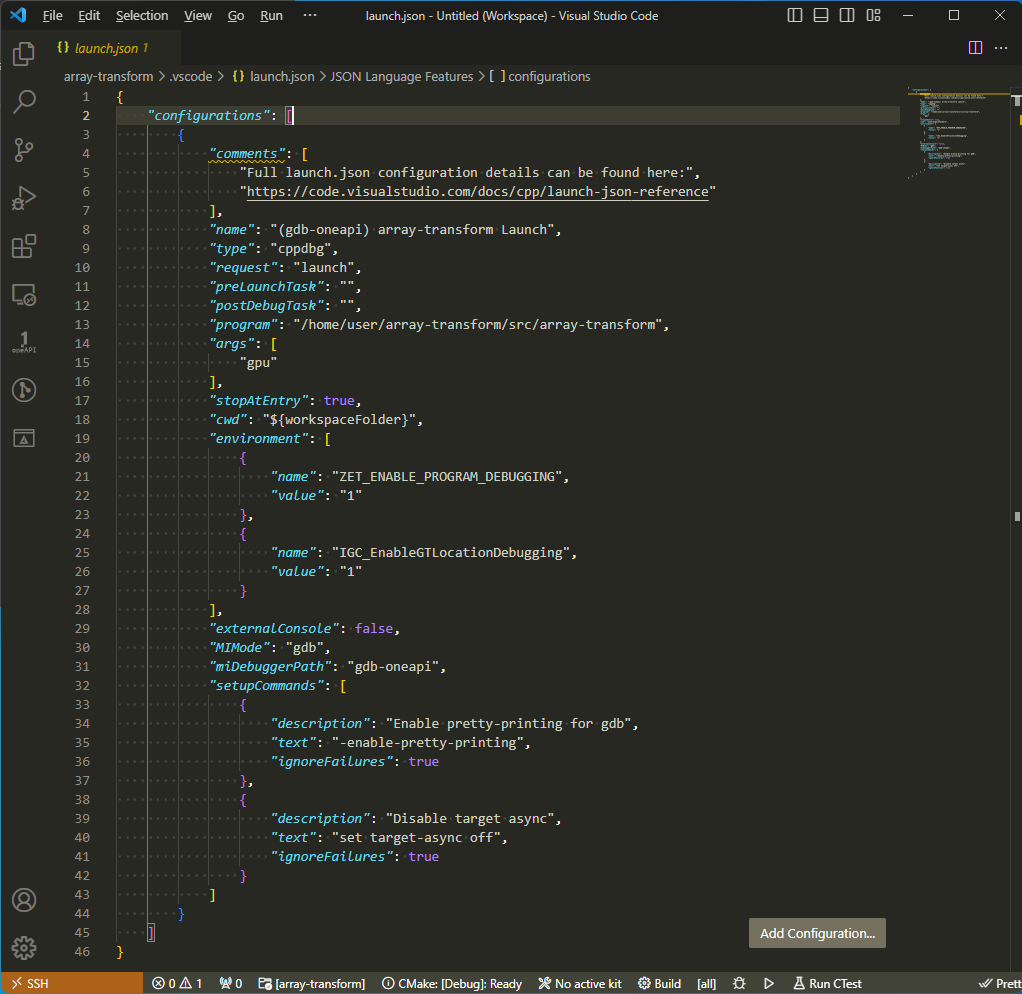
After completing all of the prompts, you will see the new argument in the .vscode/launch.json file:

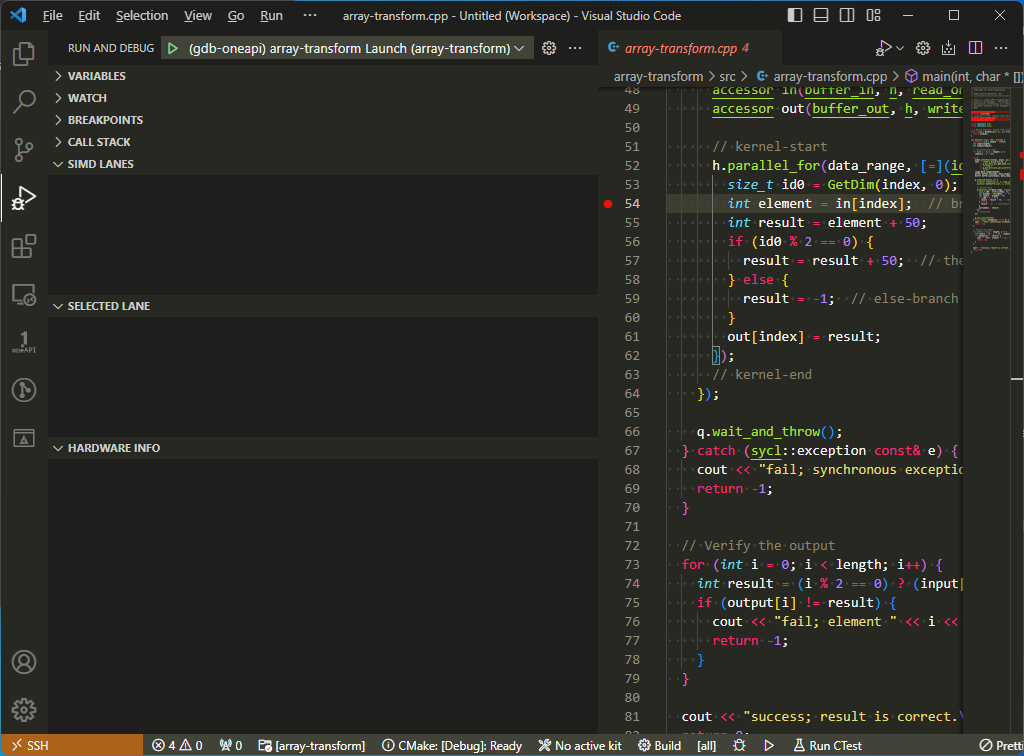
Using the VS Code Explorer, open the source code file or files that contain the section of code you plan to debug. In the example below, the array-transform.cpp file has been opened and a breakpoint has been set at line #54.

Start debugging by clicking the Run and Debug button on the left. Then click the Debug button at the top. Note the pulldown list of launch configurations next to the Debug button. The pulldown list corresponds to the “name” fields in the launch.json file located in the .vscode folder of your project folder.

Note that you can modify the configuration manually. For example, you may need to change:
"args" - Example ["arg1", "arg2"]. If you are escaping characters, you will need to double escape them. For example, ["{\\"arg1\\": true}"] will send {"arg1": true} to your application.
"stopAtEntry" - If set to true, the debugger should stop at the entry-point of the target (ignored on attach). Default value is false.
"cwd" - Sets the working directory of the application launched by the debugger.
"environment" - Environment variables to add to the environment for the program. Example: [ { "name": "config", "value": "Debug" } ], not [ { "config": "Debug" } ].
For information about launch.json features, see Configuring C/C++ debugging
SIMD View
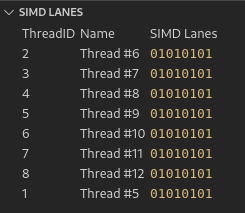
This extension provides a view in the debug view that displays the SIMD lane state of a Intel GPU thread. The view will automatically populate when hitting a GPU thread breakpoint.
ThreadID
The thread ID that GDB sees in the GPU inferior process. For example, 2.1 in the GDB console would be 1.
To rename the thread while debugging:
Press CTRL+Shift+P to open the Command Pallette.
Type Open Debug Console and press enter.
Select the desired thread with: -exec thread THREADID
Rename the thread using; -exec thread name YOURNAME
Press Continue (F5) on your debug window to see renewed threads.
Name
The string name of the GPU thread.
SIMD Lanes
The status of the SIMD lanes in the thread. Dark blue represents active lanes stopped at a breakpoint, light blue indicates active lanes that do not meet breakpoint conditions and grey indicates inactive lanes. Typically the status will be SIMD8 (8 lanes). Ideally, all lanes should be active.

SIMD Lane Specific Breakthroughs
Note that SIMD lane specific breakpoints are saved between sessions, but will be applied only after hitting a regular breakpoint inside the kernel.
There are several ways to set a SIMD lane specific breakpoint:
Add a breakpoint by right-clicking using the keyword -break-insert and specifying the thread number and SIMD lane: -break-insert -p THREADID -l SIMDLANE
Use the Intel oneAPI: Add SIMD conditional breakpoint function from the drop-down menu and specify the THREADID and SIMDLANE in format: THREADID:SIMDLANE
Symbolic Indication of SIMD Lanes
In the settings, you can specify an additional designation for active and inactive lanes using any text character. This may be useful for clearer recognition of lane status.
Choose SIMD Lane
You can choose a new SIMD lane by clicking on it. Choosing a new SIMD lane will show updated information in the SELECTED LANE tab, and extended thread information can be found using the debug console (command -exec -thread-info).
Hardware Info
You can see your device’s info in a separate tab while debugging.
Differences between GDB and GDB-oneapi
To display the differences between these two distributions of GDB:
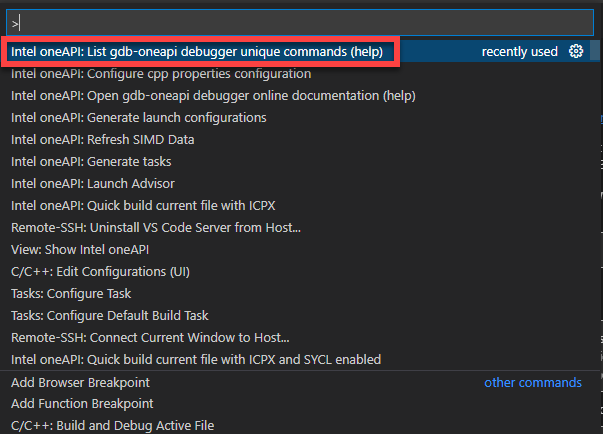
Press Ctrl+Shift+P ( or View -> Command Palette… ) to open the Command Palette.
Type help to see help commands.
Select Intel oneAPI: List gdb-oneapi debugger unique commands (help).

A new window will open showing the differences and links to documentation.
If you want quick access to GDB-oneAPI Online Documentation, select Intel oneAPI: Open gdb-oneapi debugger online documentation (help).