Analysis Configurator for Intel® Software Development Tools*
Using the Visual Studio Code* with Intel® oneAPI Toolkits
This is an extension for seamless integration with Intel® analysis tools, including the Intel® VTune™ Profiler and Intel® Advisor.
Intel® VTune™ Profiler is a performance profiling tool that provides advanced sampling and profiling techniques to quickly analyze code, isolate issues and deliver insights for optimizing performance on modern processors.
Intel® Advisor is for software architects and developers who need the right information and recommendations to make the best design and optimization decisions for efficient vectorization, threading, and offloading to accelerators.
To install the extension:
Open the Extension Marketplace in VS Code and search for oneAPI.
Install the extension titled Analysis Configurator for Intel® Software Development Tools.
Note: You may also install this extension with the Extension Pack for Intel® Software Development Tools.
With this extension, you can perform multiple functions:
Prepare Tasks
Prepare Launch Configuration
Use Intel Analysis Tools
Build a single cpp file
Use IntelliSense for Code Developed with Intel oneAPI Toolkits
Configure C++ Properties
Display tool tips
Preparing Tasks
This extension enables the ability to prepare tasks from make or cmake files:
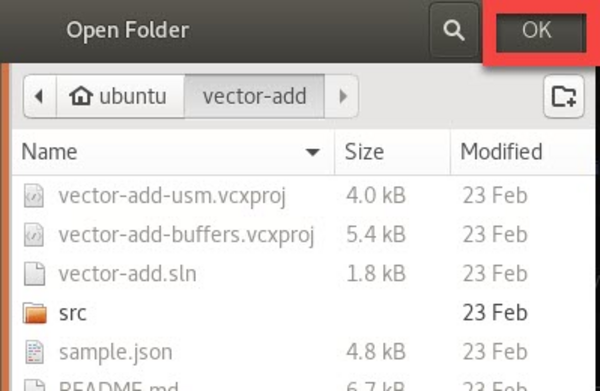
Using the VS Code explorer, click File>Open Folder.
Navigate to the folder where your project is located and click OK.
Press Ctrl+Shift+P ( or View -> Command Palette… ) to open the Command Palette.
Type Intel oneAPI and select Intel oneAPI: Generate tasks.
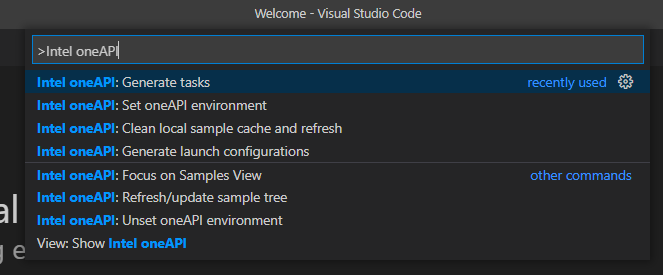
Follow the prompts to add targets from your make/cmake oneAPI project.
Run the target by selecting Terminal > Run task….
Select the task to run.

Prepare Launch Configuration
This extension enables the ability to prepare launch configurations for running and debugging projects created using Intel oneAPI toolkits:
Using the VS Code explorer, click File>Open Folder.
Navigate to the folder where your project is located and click OK.

Press Ctrl+Shift+P ( or View -> Command Palette… ) to open the Command Palette.
Type Intel oneAPI and select Intel oneAPI: Generate launch configurations.

Follow the prompts to add launch configurations.
Using the VS Code Explorer, open the C++ file for your project.
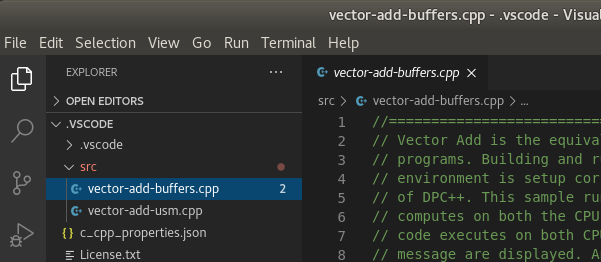
The configuration is now available to debug and run using the gdb-oneapi debugger. To debug and run, click on the Run icon
 or press Ctrl+Shift+D.
Building a Single cpp File
Open the cpp file you want to build.
Press Ctrl+Shift+P ( or View -> Command Palette… ) to open the Command Palette.
Type Intel oneAPI and select Intel oneAPI: Quick build current file with ICPX.
If you want to build a file with SYCL enabled, choose the option Intel oneAPI: Quick build current file with ICPX and SYCL enabled.
Using Intel Analysis Tools
You need to have at least one of the above Intel analysis tools installed for this extension to work and be useful.
Open a Visual Studio Code project.
Build your project to create the executable you plan to analyze.
Press Ctrl+Shift+P ( or View -> Command Palette… ) to open the Command Palette.
Type Intel oneAPI and select Intel oneAPI:Launch Advisor or Intel oneAPI: Launch VTune Profiler. Select one of the options displayed:

Change binary: show the list of all executable files in your working directory. Select an executable and select Save to save this path to in your workspace or select Once to make the change for this session only.
To see your changes, you can open File-> Preferences -> Settings, select the extensions tab and click on Analysis Configurator.
Open settings: change the default path to the binary.
Exit: take no action and exit the command pallette.
Select the executable you want to analyze. This needs to be done once for a workspace unless you want to analyze a different executable.
Select the installation path of Intel Advisor or Intel VTune Profiler. This needs to be done once for a workspace.
Enter the name of the project folder for the tool, or press enter to accept the default. This needs to be done once for a workspace.
The extension will open the analyzer tool and pass the appropriate project parameters to the tool.
How to Use IntelliSense for Code Developed with Intel oneAPI Toolkits
Make sure that the C/C++ extension is already installed.
Press Ctrl+Shift+P and and type C/C++ Edit Configurations (JSON). Press Enter. As a result, a c_cpp_properties.json file will be created in the .vscode folder.
Edit the file so that it looks like in the example:
Configure C++ Properties
This extension provides the ability to configure the cpp properties includePath, defines, and compilerPath.
Press Ctrl+Shift+P ( or View -> Command Palette… ) to open the Command Palette.
Type Intel oneAPI: configure cpp properties configuration and select it from the palette.

Select cpp standard.
Select c standard.
A message will appear in the lower right corner to confirm the properties have been configured.

To view or change the properties, open settings.json from the VS Code Explorer.
To make changes to the configuration, edit the default path in settings.json.

Display Tool Tips
To learn more about the tool tips function, see Working with Code.