Developing a Visual Studio Code Project in a Docker Container
Using Visual Studio Code* with Intel® oneAPI Toolkits
The Intel® oneAPI Toolkits support these compilers:
Intel® oneAPI DPC++ Compiler
Intel® Fortran Compiler
Intel® C++ Compiler
Containers allow you to set up and configure environments for building, running and profiling oneAPI applications and distribute them using images:
You can install an image containing an environment pre-configured with all the tools you need, then develop within that environment.
You can save an environment and use the image to move that environment to another machine without additional setup.
You can prepare containers with different sets of languages and runtimes, analysis tools, or other tools, as needed.
Download Docker* Image
You can download a Docker* image from the Containers Repository.
Singularity Containers
Build a Singularity image using a Singularity file.
Create the Container
Inside the Intel oneAPI project you just created, create a new file named Dockerfile with the following contents.
This Dockerfile will create a local Docker image on your system based on a pre-configured oneAPI Docker container stored in Docker Hub.
NOTE:A complete list of preconfigured Docker containers for Intel oneAPI can be found here: https://hub.docker.com/r/intel/oneapi.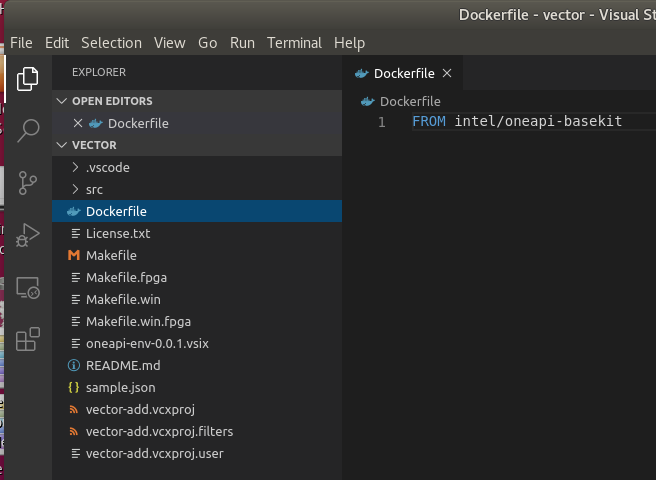
Open the Command Palette (Ctrl-Shift-P) and run Remote-Containers: Open Folder in Remote Container .

A folder selection window will appear. Choose the folder containing your Intel oneAPI project.
When prompted, choose From ‘Dockerfile’ .

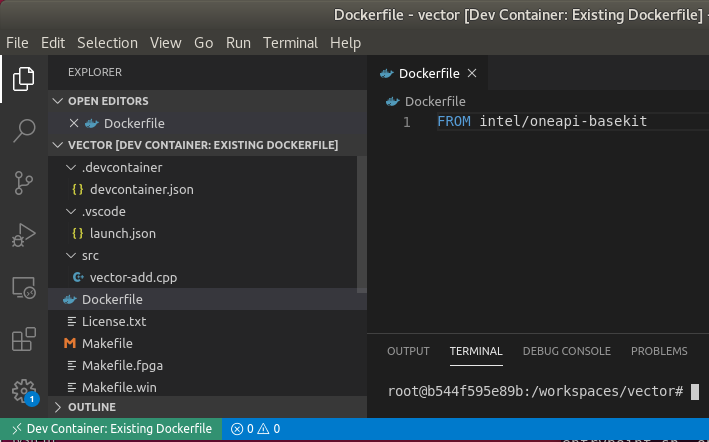
VS Code will automatically use the Dockerfile you just created to download the image, create the container, and open the project inside of the container.
NOTE:The duration of this step depends on the time it takes to download the image and create the container. Refer to the Using Containers documentation for more details.VS Code will now show that it is connected to the container.
Configure the Container
In order to debug inside of the container, you must enable debugging flags and configure the Intel oneAPI development environment variables within the container. This can be done by editing the .devcontainer/devcontainer.json file.
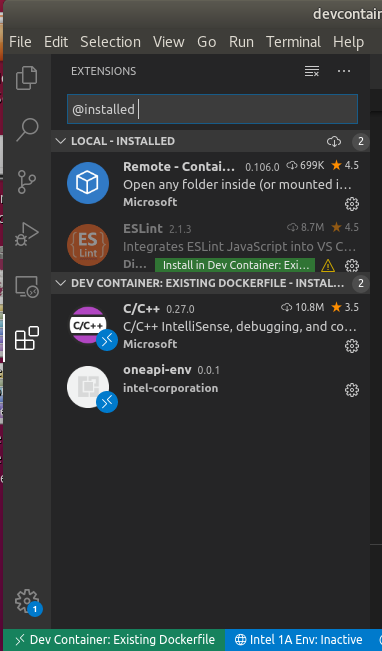
An extension is required to debug Intel oneAPI projects inside of a container. The Microsoft VS Code C/C++ Extension is required to configure the GDB debugger. This can installed automatically by adding it to the container configuration file. Edit the “extensions” line in .devcontainer/devcontainer.json:
NOTE:The Intel extension is not POR and it is not available in the Marketplace.If you will be using a ptrace-based debugger for programming languages such as C++, Go, and Rust, you will need to enable debugging within the container. Uncomment the “runArgs” line in .devcontainer/devcontainer.json:
In order to apply these changes to the container, it must be rebuilt. Open the Command Palette and run Remote-Containers: Rebuild Container .
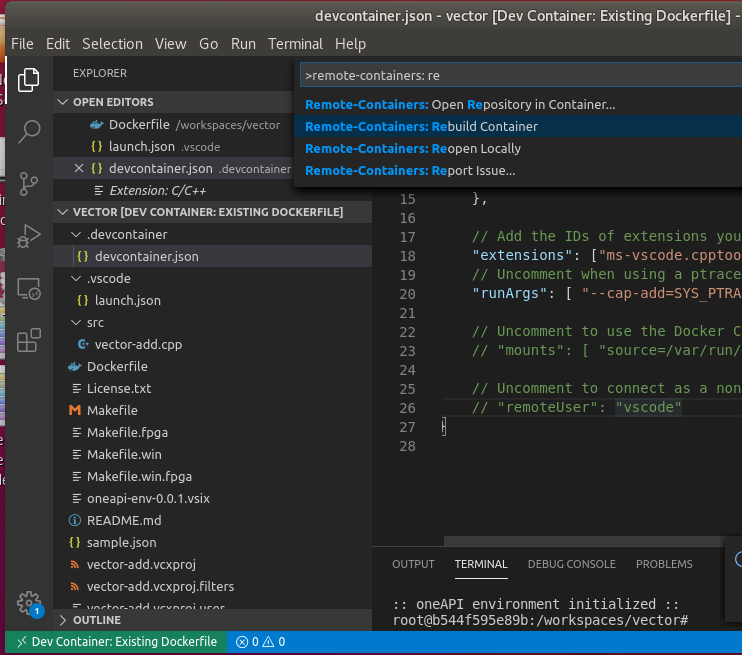
The container will be rebuilt and show that the extensions have been installed.
Build a Sample Project
To build the project, follow the instructions in README.md. Note that when you open a Terminal in VS Code (Ctrl-Shift-) while connected to a container, it opens a login terminal inside of the container.
Before working with oneAPI samples, it is recommended that you install the VS Code “Sample Browser for Intel oneAPI Toolkits” extension. It can be found in the VS Code extensions marketplace by typing “oneapi” into the marketplace search bar.
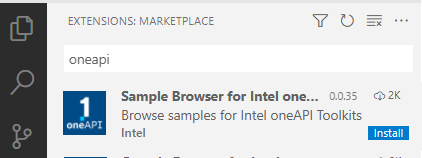
After the extension is installed, browse oneAPI samples using VS Code:
Click on the oneAPI button on the left navigation to view samples. If you do not have the extension installed, search the Extensions Marketplace for “Sample Browser for Intel oneAPI Toolkits”.

A list of available samples will open in the left navigation.
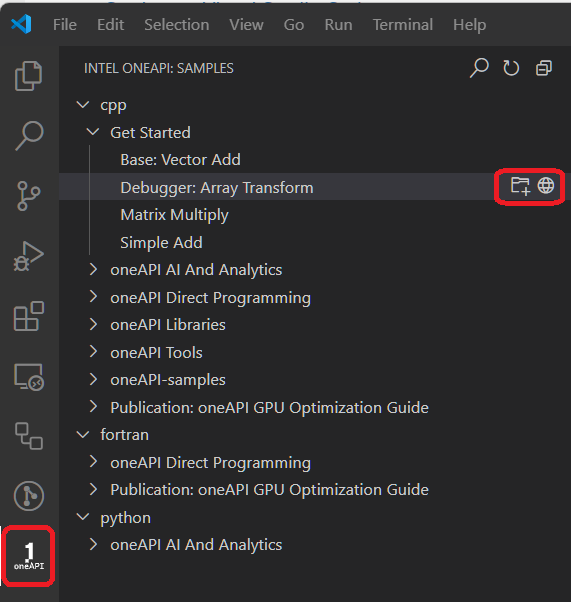
To view the readme for the sample, click the
 next to the sample. If you choose to build and run the sample, the readme will also be downloaded with the sample.
To build and run a sample, click the
 to the right of the sample name.
Create a new folder for the sample. The sample will load in a new window:
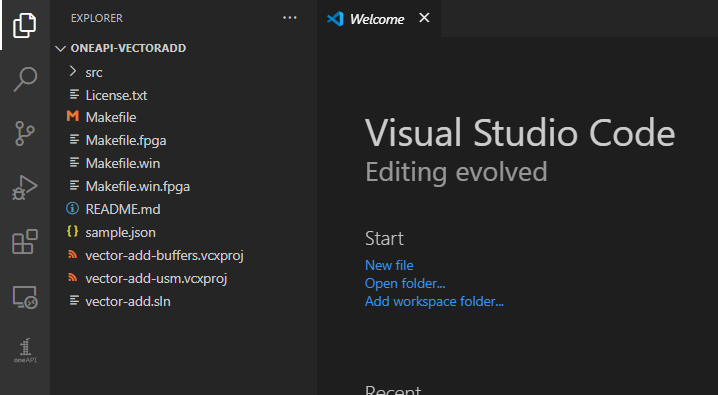
Click README.md to view instructions for the sample.
Try Debugging (CPU and GPU Only) (Preview)
This section assumes that you can build your sample and have installed the Microsoft VS Code C/C++ Extension. The C/C++ extension is required to configure the oneAPI C/C++ debugger.
The Intel® oneAPI Base Toolkit includes a special version of GNU* GDB (gdb-oneapi) designed to support oneAPI C/C++ applications. To debug your DPC++ application using this special debugger, you will need to make changes to the .vscode/launch.json configuration file.
Go to Debug > Open Configurations, and open the launch.json configuration settings.

Copy the code shown below into your launch.json file, and replace the "program": property’s value with the path to your project’s executable (that is, the application that you are going to debug).
Add gdb-oneapi to your launch.json configuration’s "miDebuggerPath": property.
In some configurations, GDB may not be compatible with VS Code. If this happens, add the environment variable to disable `gdb-oneapi` support for GPU autolaunch. This can either be done in the environment prior to launching VS Code, or within the launch.json: export INTELGT_AUTO_ATTACH_DISABLE=1
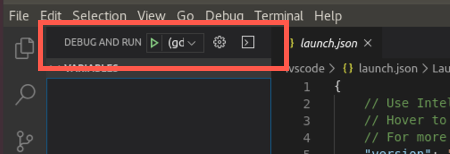
Bring up the debug view by selecting the Run icon in the Activity Bar. You can also use the keyboard shortcut (Ctrl+Shift+D).

Start the run and debug session by clicking the green DEBUG AND RUN icon, or go to Run > Start Debugging (F5).
Disconnect from the Container
You can close the VS Code connection to the container by selecting File > Close Remote Connection from the VS Code menu. Alternatively, click the colored Dev Container notification in the lower-left corner of the VS Code window and select Close Remote Connection from the list of Remote-Container commands.