Developing a Visual Studio Code Project
Using Visual Studio Code* with Intel® oneAPI Toolkits
The steps below describe how to install oneAPI extensions for Visual Studio Code and use them to set up your environment, browse samples and create projects. If you prefer to watch a video presentation of how to do these tasks, see oneAPI Visual Studio Code Extensions.
Explore Samples Using Visual Studio Code*
Before working with oneAPI samples, it is recommended that you install the VS Code “Code Sample Browser for Intel® Software Development Tools” extension and the VS Code “Environment Configurator for Intel® Software Development Tools” extension.
Both can be quickly found in the VS Code extensions marketplace by typing “oneapi” into the marketplace search bar.
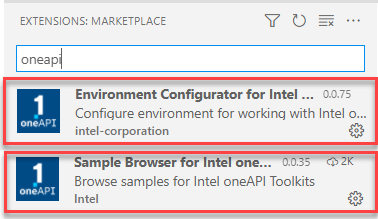
You may also choose to install the “Extension Pack for Intel® Software Development Tools”, which includes those two extensions as well as additional VS Code extensions to help you develop with Intel® oneAPI Toolkits.
The steps below describe how to use these extensions to configure the oneAPI development environment for use with VS Code and use the Sample Browser to locate and create sample projects that help you learn how to use oneAPI features.
Browse oneAPI samples using VS Code:
Click on the oneAPI button on the left navigation to view samples. If you do not have the extension installed, search the Extensions Marketplace for “Sample Browser for Intel oneAPI”.

A list of available samples will open in the left navigation.
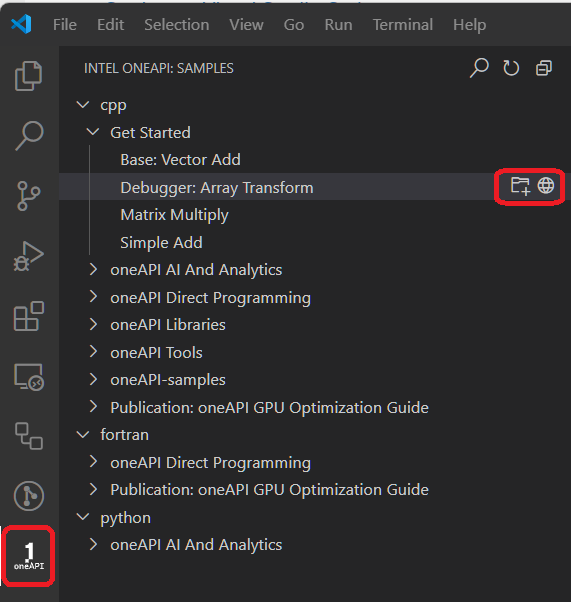
To view the readme for the sample, click the
 next to the sample. If you choose to build and run the sample, the readme will also be downloaded with the sample.
To build and run a sample, click the
 to the right of the sample name.
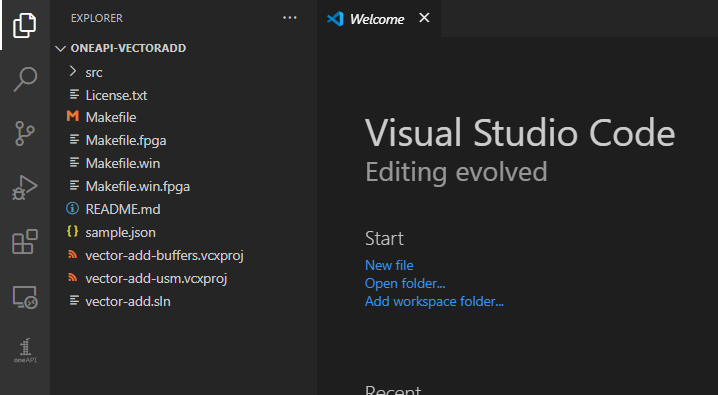
Create a new folder for the sample. The sample will load in a new window:
Configure the oneAPI Environment
PressCtrl+Shift+P ( or View -> Command Palette… ) to open the Command Palette.
Type Intel oneAPI to view options of the installed extensions.
Click on Intel oneAPI: Initialize environment variables.
Locate the setvars | oneapi-vars file:
Linux: By default in the Component Directory Layout, setvars.sh is located in /opt/intel/oneapi/ for root or sudo installations, or located in ~/intel/oneapi/ for local user installations.
Linux: By default in the Unified Directory Layout, oneapi-vars.sh is located in /opt/intel/oneapi/<toolkit-version>/ for root or sudo installations, or located in ~/intel/oneapi/ for local user installations.
Windows: By default in the Component Directory Layout, setvars.bat is located in C:\Program Files(x86)\Intel\oneAPI\
Windows: By default in the Unified Directory Layout, oneapi-vars.bat is located in C:\Program Files(x86)\Intel\oneAPI\<toolkit-version>\
To understand more about the Unified Directory Layout, including how the environment is initialized and the advantages of using the layout, see oneAPI Development Environment Setup.
If you customized the installation folder, setvars | oneapi-vars is in your custom folder.
In the case of multiple folders in workspace, select the appropriate one. All tasks, launches, and terminals created from VS Code will now contain the oneAPI environment.
Build and Run
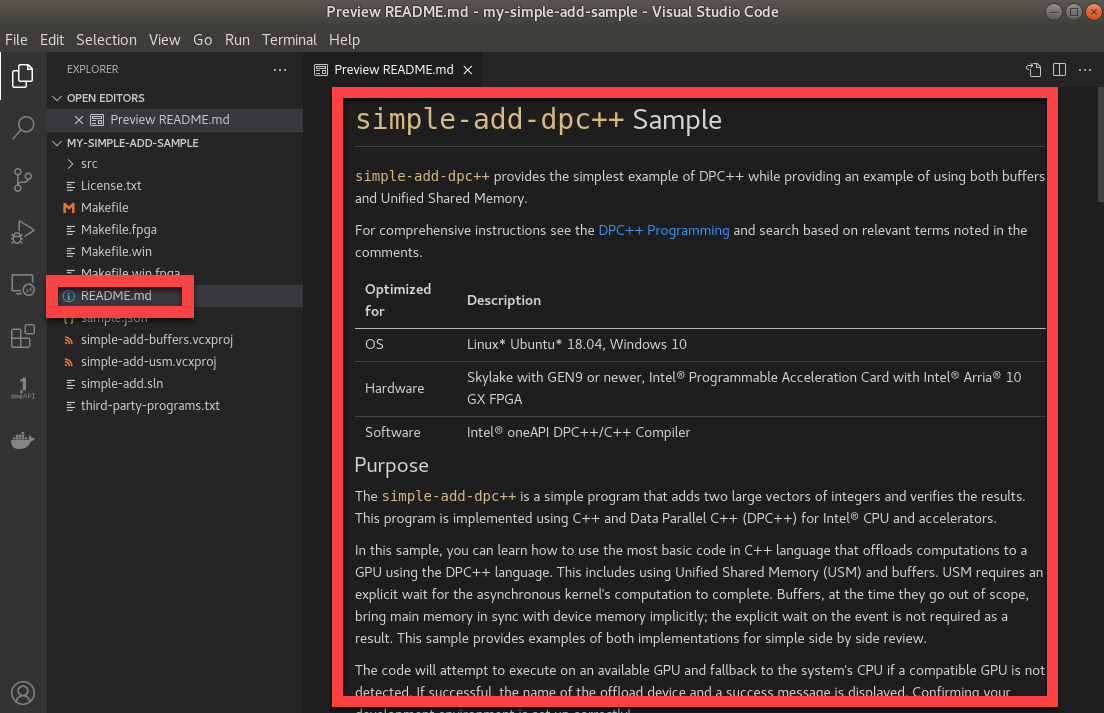
Follow the instructions in the README.md for the sample.
Try Debugging (CPU and GPU Only)
The GDB with GPU Debug Support for Intel® oneAPI Toolkits extension for Visual Studio Code (VS Code) enables additional features of GPU debugging with GDB for Intel® oneAPI toolkits. Note that this feature is only available for the Linux* target platform. Start using this VS Code extension with guide Get Started with Intel® Distribution for GDB* on Linux* OS Host.
This section assumes that you can build your sample and have installed the Microsoft VS Code C/C++ Extension. The C/C++ extension is required to configure the oneAPI C/C++ debugger.
The Intel® oneAPI Base Toolkit includes a special version of GNU* GDB (gdb-oneapi) designed to support oneAPI C/C++ applications. To debug your DPC++ application using this special debugger, you will need to make changes to the .vscode/launch.json configuration file.
Go to Debug > Open Configurations, and open the launch.json configuration settings.
NOTE:If you are prompted to select a debug environment, choose C++ (GDB/LLDB).
Copy the code shown below into your launch.json file, and replace the "program": property’s value with the path to your project’s executable (that is, the application that you are going to debug).
NOTE:If VS Code doesn’t recognize the application name, you may have to insert the full path and file name into the launch.json file’s "program": property.Add gdb-oneapi to your launch.json configuration’s "miDebuggerPath": property.
NOTE:The gdb-oneapi application should have been added to your path when you ran setvars.sh | oneapi-vars.sh to configure the oneAPI development environment, prior to starting VS Code. If you prefer, you can specify the full path and filename to the gdb-oneapi application in your launch.json file.In some configurations, GDB may not be compatible with VS Code. If this happens, add the environment variable to disable gdb-oneapi support for GPU autolaunch. This can either be done in the environment prior to launching VS Code, or within the launch.json: export INTELGT_AUTO_ATTACH_DISABLE=1
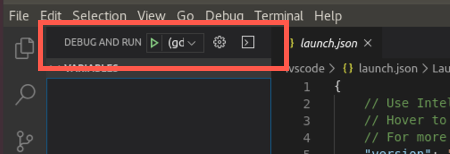
Bring up the debug view by selecting the Run icon in the Activity Bar. You can also use the keyboard shortcut (Ctrl+Shift+D).

Start the run and debug session by clicking the green DEBUG AND RUN icon, or go to Run > Start Debugging (F5).
Quick Access to Code Samples
oneAPI has robust VS code support. There are a couple of extensions that you can use to add support for quick access to code samples. This must be done for each new project.
Launch VS code from a shell where set_vars.sh/set_vars.bat has already been run.
Install Microsoft’s C/C++ Extension.
Press Ctrl + Shift + P to open the palate, and choose ‘Edit Configurations (JSON)’.
Add the following configuration (and set it as the first one): oneAPI 2024.0 (Linux) VS Code Configuration
oneAPI 2024.0 (Windows) VS Code Configuration