Developing a Visual Studio Code* Project for Development on Windows Subsystem for Linux*
Using Visual Studio Code* with Intel® oneAPI Toolkits
This guide assumes you are familiar with C/C++ development and the Visual Studio Code (VS Code) editor. If you are new to Visual Studio Code, review the following VS Code documentation links:
The following procedure uses a Remote Host connection enabling you to edit and debug your code using the Windows Subsystem for Linux* (WSL).
Prerequisites
Visual Studio Code for Linux
A Linux distribution running on WSL with the Intel® oneAPI Base Toolkit (Base Kit) installed
Install the Visual Studio Code Remote WSL Extension on Your Local Host
You must add the VS Code Remote - WSL extension into your installation of VS Code on Windows. This extension facilitates development on the WSL* system.
Install the Remote - WSL extension by Microsoft. Click the Extensions icon and search for “remote wsl” in the search bar.
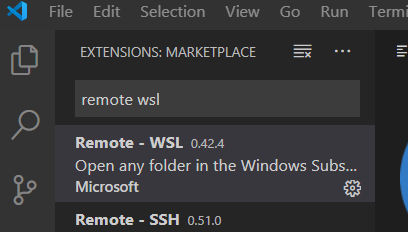
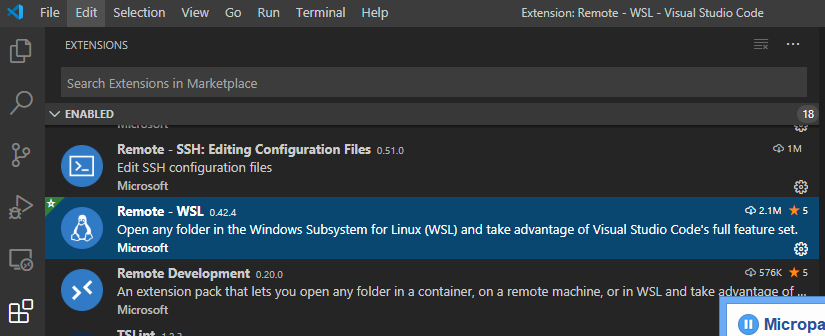
Click install. After installation, Remote – WSL will be in the Installed Extensions list.
Install the oneAPI Base Toolkit on the WSL Target Linux
In order to develop on your remote WSL target, you must install (at minimum) the Intel® oneAPI Base Toolkit (Base Kit) and configure the oneAPI development environment variables on the WSL target Linux. The recommended oneAPI Toolkit installation method is Installing via Linux* Package Managers.
Open a WSL terminal and install the Base Kit on to that target Linux system using the appropriate Linux package manager.
Set up the oneAPI Environment and Connect VS Code to your WSL Linux System
Assuming you have installed your oneAPI Toolkits on the WSL system in the default root/sudo installation location (/opt/intel/oneapi/), open a WSL terminal shell and enter the following at the shell prompts. If you have installed the oneAPI tools in a different location on your remote Linux system, you will have to adjust the path to setvars.sh.
NOTE:See Configure Your CPU or GPU System for more details regarding configuration of the oneAPI environment on a Linux system.A new VS Code window opens and is connected to the WSL system.
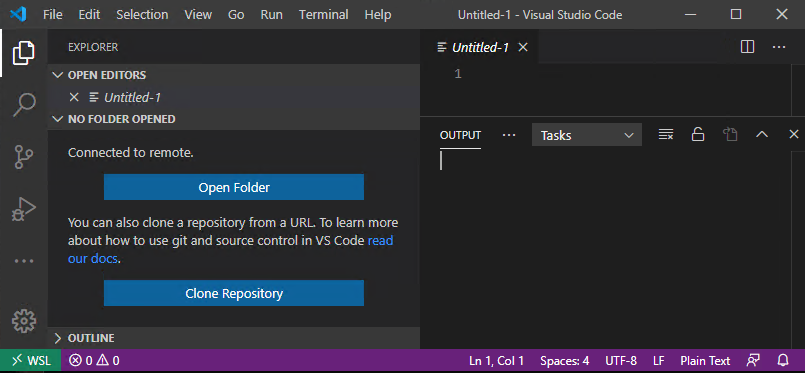
Once connected, add the Microsoft C/C++ Extension Pack for Visual Studio Code. This extension provides Intellisense and debug support for C/C++ applications.
See the Visual Studio Code Remote Development in WSL documentation for detailed instructions, requirements, and additional information.
Configuring Intellisense and Debug
In order to make VS Code work well with C/C++ development, it is necessary to configure 2 key JSON files in your project’s .vscode folder: c_cpp_properties.json and launch.json. The c_cpp_properties.json file instructs the Intellisense feature on how to locate include headers and the Intel compiler. The launch.json file defines debug configurations to configure the gdb-oneapi application debugger. An introduction and general background for using the VSCode debugger can be found in the Microsoft Debug C++ in Visual Studio Code documentation. To understand and learn about Intellisense, see the Configure C/C++ IntelliSense documentation.
The following pre-configured JSON files will help you get started with IntelliSense and debugging in an Intel oneAPI development environment. This c_cpp_properties.json file is configured for a 2024.0 or later release. See the comments in the JSON file for help on how to modify it to work with a 2023.2 or earlier release.
If VS Code indicates one or more problems with this file, it might need to be re-configured for a release that is prior to 2024.0. Unneeded path references can be removed or commented out.
This launch.json file is configured to work with the “array-transform” example application. It provides two configurations named “CPU array-transform” and “GPU array-transform”.
The key attributes in the launch.json file are:
name: Identifies the specific debug configuration.
program: Provides the path to the executable that will be debugged.
args: Arguments to be passed to the debugger on its command-line.
environment: Defines environment variables that will be exported prior to starting the debug session.
setupCommands: Specifically, disabling the mi-async feature; enabling it will generate GPU seg faults.
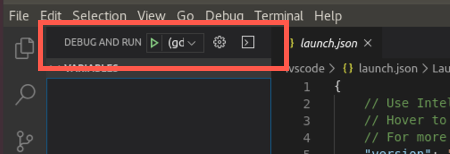
The name attribute is used only as an identifier for the configuration, as shown in the following image:
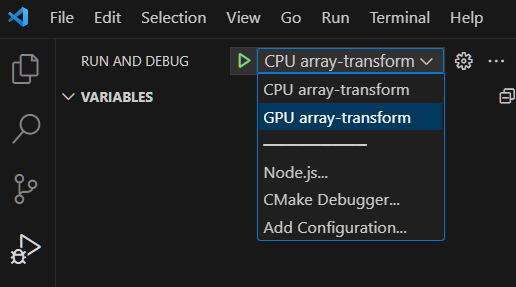
You can create as many debug configurations as you need, the name field inside each configuration is there to help you distinguish which configuration you will use for your debug session.
Explore Samples Using Visual Studio Code*
Before working with oneAPI samples, it is recommended that you install the VS Code “Sample Browser for Intel oneAPI Toolkits” extension and, optionally, the VS Code “Environment Configurator for Intel® Software Development Tools” extension.
Both can be quickly found in the VS Code extensions marketplace by typing “oneapi” into the marketplace search bar.
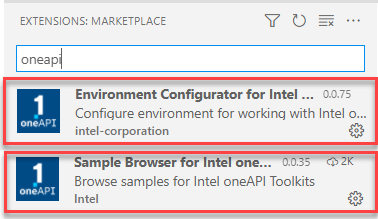
To browse oneAPI samples using VS Code:
Click on the oneAPI button on the left navigation to view samples.
A list of available samples will open in the left navigation:
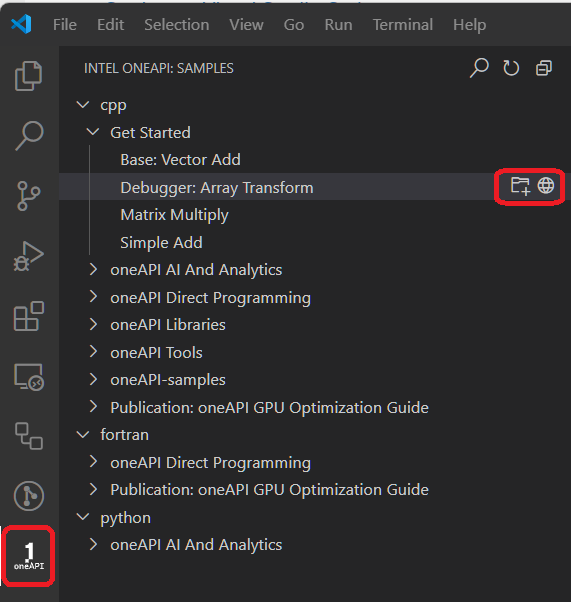
To view the sample readme, click the
 next to the sample. If you choose to build and run the sample, the readme will also be downloaded with the sample.
To download a sample, click the
 to the right of the sample name.
Create a new folder for the sample. The sample will load in a new window:
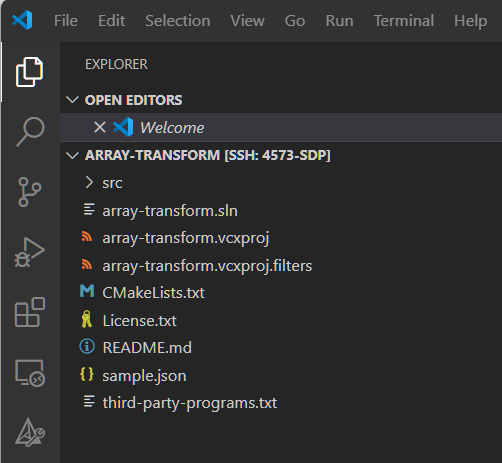
Click README.md to view instructions for the sample.
Try Debugging (CPU and GPU)
The GDB with GPU Debug Support for Intel® oneAPI Toolkits extension for Visual Studio Code (VS Code) enables additional features of GPU debugging with GDB for Intel® oneAPI toolkits. Note that this feature is only available for the Linux* target platform. Start using this VS Code extension with guide Get Started with Intel® Distribution for GDB* on Linux* OS Host.
This section assumes that you can build your sample and have installed the C/C++ Extension Pack for Visual Studio Code. The C/C++ extension is required to configure the oneAPI C/C++ debugger.
The Intel® oneAPI Base Toolkit includes a special version of GNU* GDB (gdb-oneapi) designed to support oneAPI C/C++ applications. To debug your DPC++ application using this special debugger, you will need to make changes to the .vscode/launch.json configuration file. The launch.json file defines debug configurations to integrate with the gdb-oneapi application debugger. This launch.json file is configured to work with the array-transform example application. It provides two configurations named CPU array-transform and GPU array-transform.
Create a .vscode folder in your sample’s workspace folder.
Copy the c_cpp_properties.json and launch.json files that are shown in the “Configuring Intellisense and Debug” section of this document. The c_cpp_properties.json and launch.json files are pre-configured for use with the array-transform sample application.
NOTE:If VS Code doesn’t recognize the application name, you may have to insert the full path and file name into the launch.json file’s "program": property.The key attributes in the launch.json file above are name (identifies the specific debug configuration), program (provides the path to the executable that will be debugged), args (arguments to be passed to the debugger on its command-line), environment (defines environment variables that will be exported prior to starting the debug session), and setupCommands (disables the mi-async feature; enabling it will generate GPU seg faults). The name attribute is used only as an identifier for the configuration. You can create as many debug configurations as you need.
In some configurations, GDB may not be compatible with VS Code. If this happens, add the environment variable to disable gdb-oneapi support for GPU autolaunch. This can either be done in the environment prior to launching VS Code, or within the launch.json: export INTELGT_AUTO_ATTACH_DISABLE=1
Bring up the debug view by selecting the Debug and Run icon in the Activity Bar. You can also use the keyboard shortcut (Ctrl+Shift+D).

Start the run and debug session by clicking the green DEBUG AND RUN icon, or go to Run > Start Debugging (F5).
