A newer version of this document is available. Customers should click here to go to the newest version.
Visible to Intel only — GUID: GUID-0297A2B9-BD61-46F9-AC69-BD37731FCDC0
Visible to Intel only — GUID: GUID-0297A2B9-BD61-46F9-AC69-BD37731FCDC0
Manage Analysis with Graphics Monitor
Graphics Monitor is the hub tool of the Intel® GPA suite. It enables you to configure analysis settings, capture frames, streams and traces and open them using the respective tools.
You can use Graphics Monitor to launch applications for analysis and manage different aspects of profiling.

Manage Analysis Options
Before you begin your analysis, it is recommended to configure your analysis options using the Options window to align the tool behavior with your needs.
See the Configure Analysis Settings section for details.
Launch Applications for Analysis
To launch your applications for analysis using Graphics Monitor:
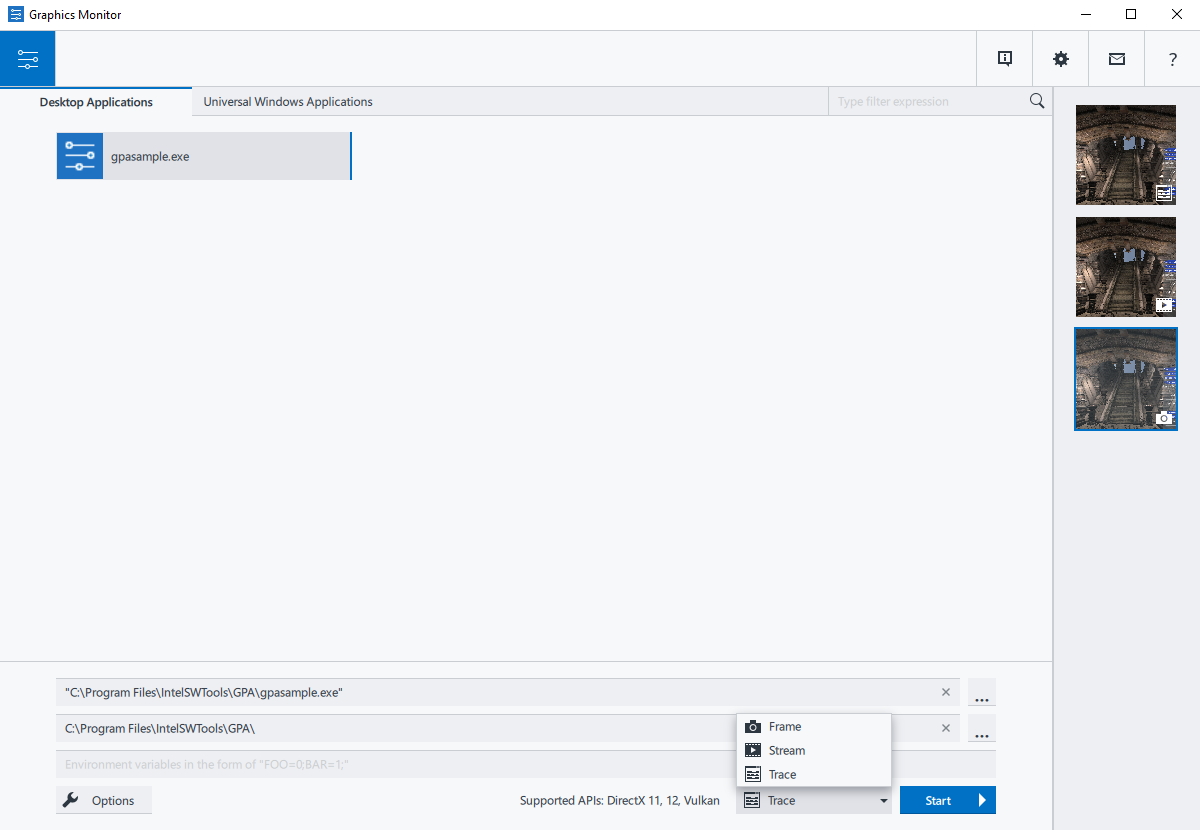
- Select an application for analysis. To do that, browse to the application binary and working directory using the text boxes. Alternatively, select a previously launched application from the application history.
- Select the application startup mode from the Application Startup Mode drop-down menu at the bottom. Select the mode that corresponds to the type of performance data you want to capture. There are three modes available:
- Frame: choose this mode to monitor real-time metrics and capture a frame. This mode supports DirectX* 9, 10, and 11 applications.
- Frame [DX12]: choose this mode to monitor real-time metrics and capture a frame for DirectX 12 applications. This mode supports DirectX 12 Ultimate features, like Mesh Shading and Ray Tracing.
- Trace: choose this mode to monitor real-time metrics and capture a trace.
- Stream: choose this mode to capture a sequence of frames. This can be useful for isolating sporadic performance problems that only affect a subset of frames.
NOTE:- If your application uses multiple graphics APIs, you can use the Extended Profiling Modes toggle in the Graphics Monitor Settings pane. When enabled, the launch modes drop-down menu is extended, allowing you to explicitly specify the graphics API to use.
- Stream capturing is not supported on Linux* OS.
Press Start to run the application.
Your application starts with the Heads-Up Display (HUD) enabled. HUD is an overlay provided at the top left of the screen when you launch the application. HUD displays system and application statistics on application performance using the GPU and CPU performance metrics.
Next Steps
Once you launch your application, use the HUD to track performance in real-time. Capture a frame, trace, or a stream to investigate the performance issue deeper using other tools of the Intel® GPA toolset.
Monitoring options in the HUD for DirectX 12 applications differ from the previous API versions and will be evolving with the next product versions.