A newer version of this document is available. Customers should click here to go to the newest version.
Visible to Intel only — GUID: GUID-EA87CDDF-E00F-4569-A9BE-640C9D6F0022
Visible to Intel only — GUID: GUID-EA87CDDF-E00F-4569-A9BE-640C9D6F0022
Graphics Monitor Window: Options Dialog Box
Use the Options dialog box to configure trace, stream, and frame collection settings and specify GPU metrics for analysis.
To access the Options dialog box, click the Options button on the Graphics Monitor window. The Options dialog box comprises the following tabs:
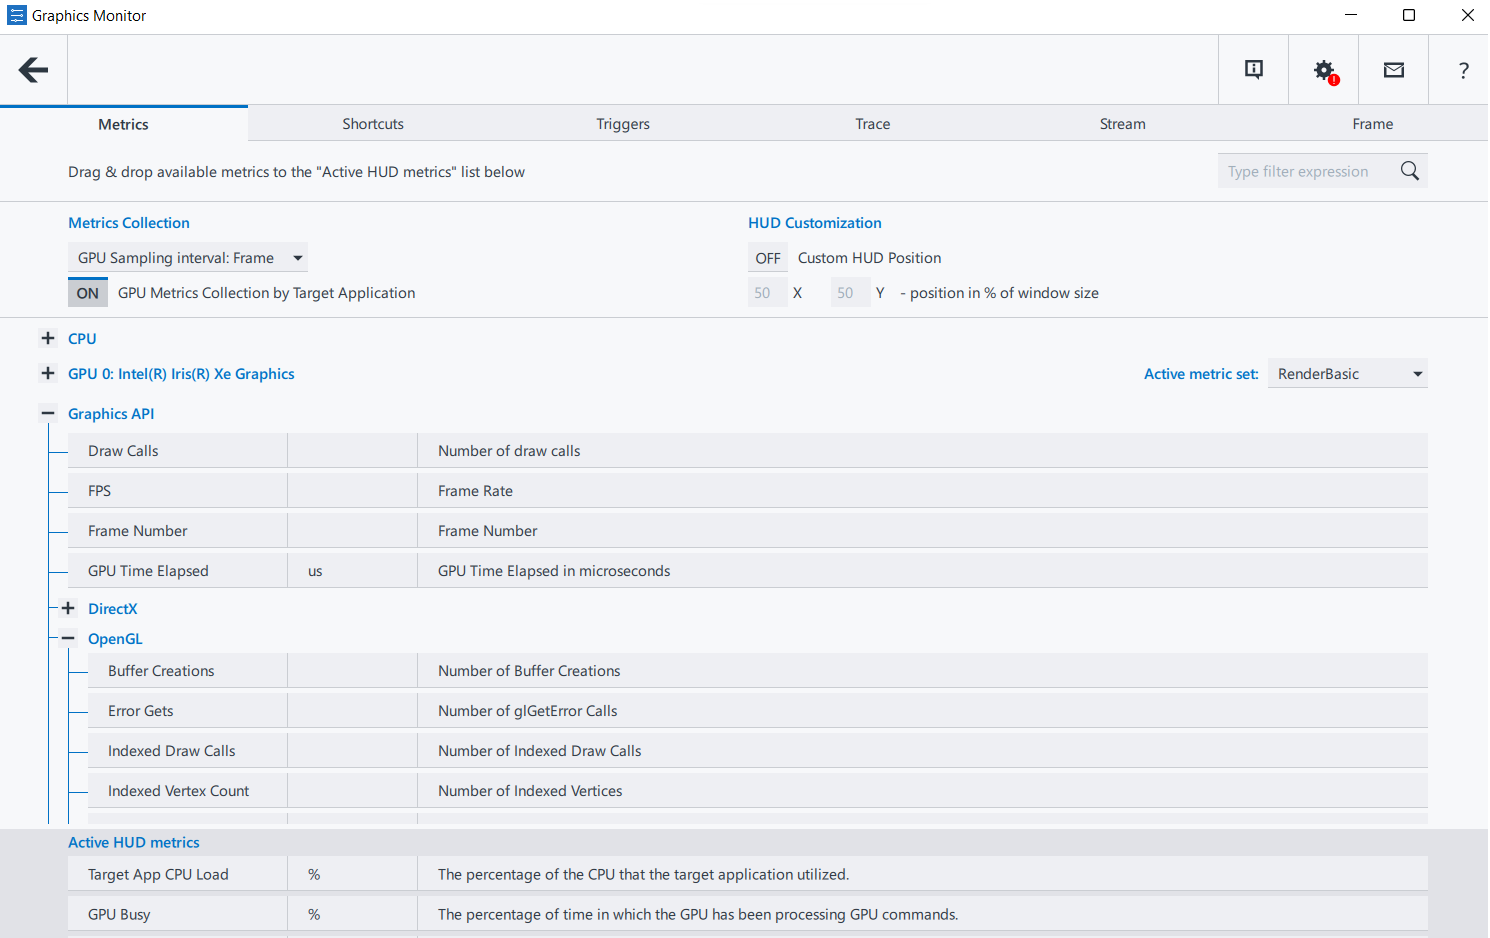
- Metrics: choose metrics to be displayed in the Heads-Up Display (HUD) in the target application, customize the HUD position, and configure metrics collection.
- Shortcuts: view and change the default keyboard shortcuts.
- Triggers: enable and configure a trigger.
- Trace: set trace collection settings.
- Stream: set stream collection settings.
- Frame: set frame delimiters.
Metrics Tab

Use the Metrics tab to do the following:
- Configure the GPU sampling interval
- Enable/disable GPU metrics collection by the target application
- Customize the System Analyzer Heads-Up Display (HUD) position
- Configure the HUD metrics
- Select the active metric set from a list for each Intel® Graphics adapter
The Metrics tab comprises two lists:
- List of all available HUD metrics
- List of active HUD metrics
To configure the HUD metrics for the target application, drag and drop a metric from the list of available metrics to the list of active HUD metrics. The maximum number of active HUD metrics is four. To restore the default list of active HUD metrics, click the ![]() button. To change the displayed metrics, remove a metric from the Active HUD metrics list by dragging and dropping this metric back to the list of available HUD metrics, or reorder the Active HUD metrics list by dragging and dropping a desired metric over another active metric. Use the search bar at the top of the tab to find relevant metrics. To select the active metric set, use the Active metric set drop-down menu in the GPU section of the metric tree.
button. To change the displayed metrics, remove a metric from the Active HUD metrics list by dragging and dropping this metric back to the list of available HUD metrics, or reorder the Active HUD metrics list by dragging and dropping a desired metric over another active metric. Use the search bar at the top of the tab to find relevant metrics. To select the active metric set, use the Active metric set drop-down menu in the GPU section of the metric tree.
Shortcuts Tab

The Shortcuts tab enables you to substitute a default keyboard shortcut with a custom value . To change a shortcut, click the shortcut value, and then click the buttons combination that you want to use as a new shortcut: start with a combination of modifier keys (ALT, CTRL, SHIFT) and end with an alpha-numeric character key. To restore default shortcut values, click the ![]() button. Use the search field at the top of the tab to find relevant shortcuts.
button. Use the search field at the top of the tab to find relevant shortcuts.
Triggers Tab

The Triggers tab enables you to set a custom condition for frame, trace, or system trace capturing. For instructions on setting up a trigger, see Set Up a Trigger.
Trace Tab

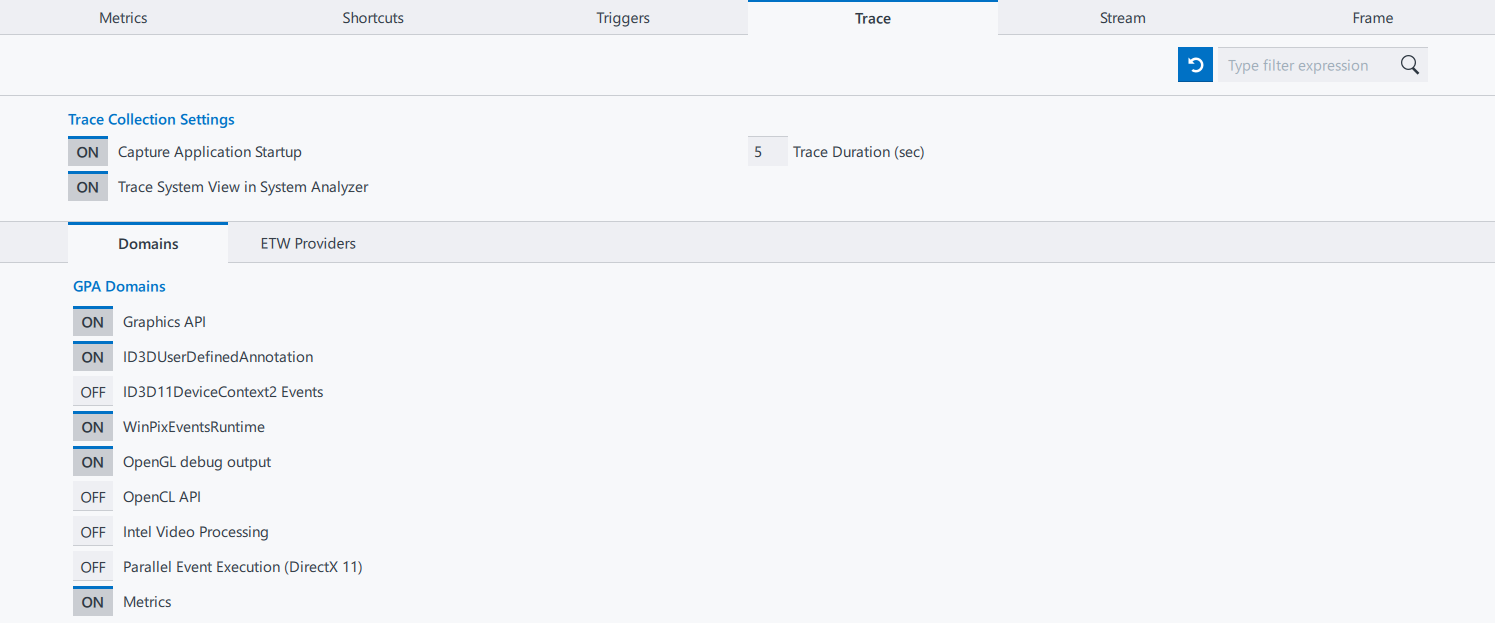
In the Trace tab you can modify tracing options:
- Enable capturing a trace upon the application startup.
- Enable Trace System View in System Analyzer.
- Change the duration of the application run to be captured in a single trace file. By default, the trace duration is five seconds.
- Select predefined Intel GPA domains to collect data about. For example, enable capturing of events to show parallel execution data in Graphics Trace Analyzer for DirectX* 11 applications.
NOTE:
ID3DUserDefinedAnnotation, ID3D11DeviceContext2 Events, and WinPixEventsRuntime apply to the debug annotation API. It is not recommended to use these domains in the code together and enable these domains simultaneously in the Trace tab. The default settings represent the common use case.
- Select User ITT Domains to collect data about. The list of user domains is gathered from the analyzed applications defining them with Instrumentation and Tracing Technology API (ITT API) and is updated upon exit from the application.
- (Windows* only) Click ETW Providers to add custom Event Tracing for Windows event providers.
To restore the default tracing parameters, click the  button. Use the search field at the top of the tab to find relevant domains.
Stream Tab

Use the Stream tab to configure the following stream capture settings:
Enable stream compression to reduce the captured stream size by up to 30%. This option is also useful if you store streams for such tasks as regression testing. (DirectX* 12, Vulkan* specific).
NOTE:When capturing streams from workloads with a high CPU load, enabling the compression may result in significant FPS reduction/performance drop since the compression adds an additional CPU overhead. In such cases, the reduced stream size results from a smaller number of captured frames per second.
- Enable deferred stream capturing. Streams are captured upon pressing L . (DirectX* 12, Vulkan* specific)
- Create a keyframe at a specified time interval.
- Create a keyframe upon pressing a key.
- Enable/disable screenshots creation in a specified sequence of frames.
- Enable/disable screenshots creation in a specified time interval.
NOTE:
You can disable screenshots creation to overcome possible overheads caused by this function.
- Enable/disable a HUD layer in the running application window.
- Enable/disable a Metrics layer in the running application window.
Frame Tab

Use the Frame tab to set frame delimiters for OpenGL and DirectX 12 applications. Frame delimiter is an API call acting as a frame border. Set frame delimiters to enable Intel GPA analysis for applications that do not use default frame delimiters.
OpenGL Frame Delimiters:
- SwapBuffers
- SetCurrentContext
- glBlitFramebuffer
- glClear
- glFinish
- glFlush
DirectX 12 frame delimiters:
- Present
- ExecuteCommandLists
Use the Frame compression option (DirectX 12 only) to reduce the captured frame size by up to 30%.