A newer version of this document is available. Customers should click here to go to the newest version.
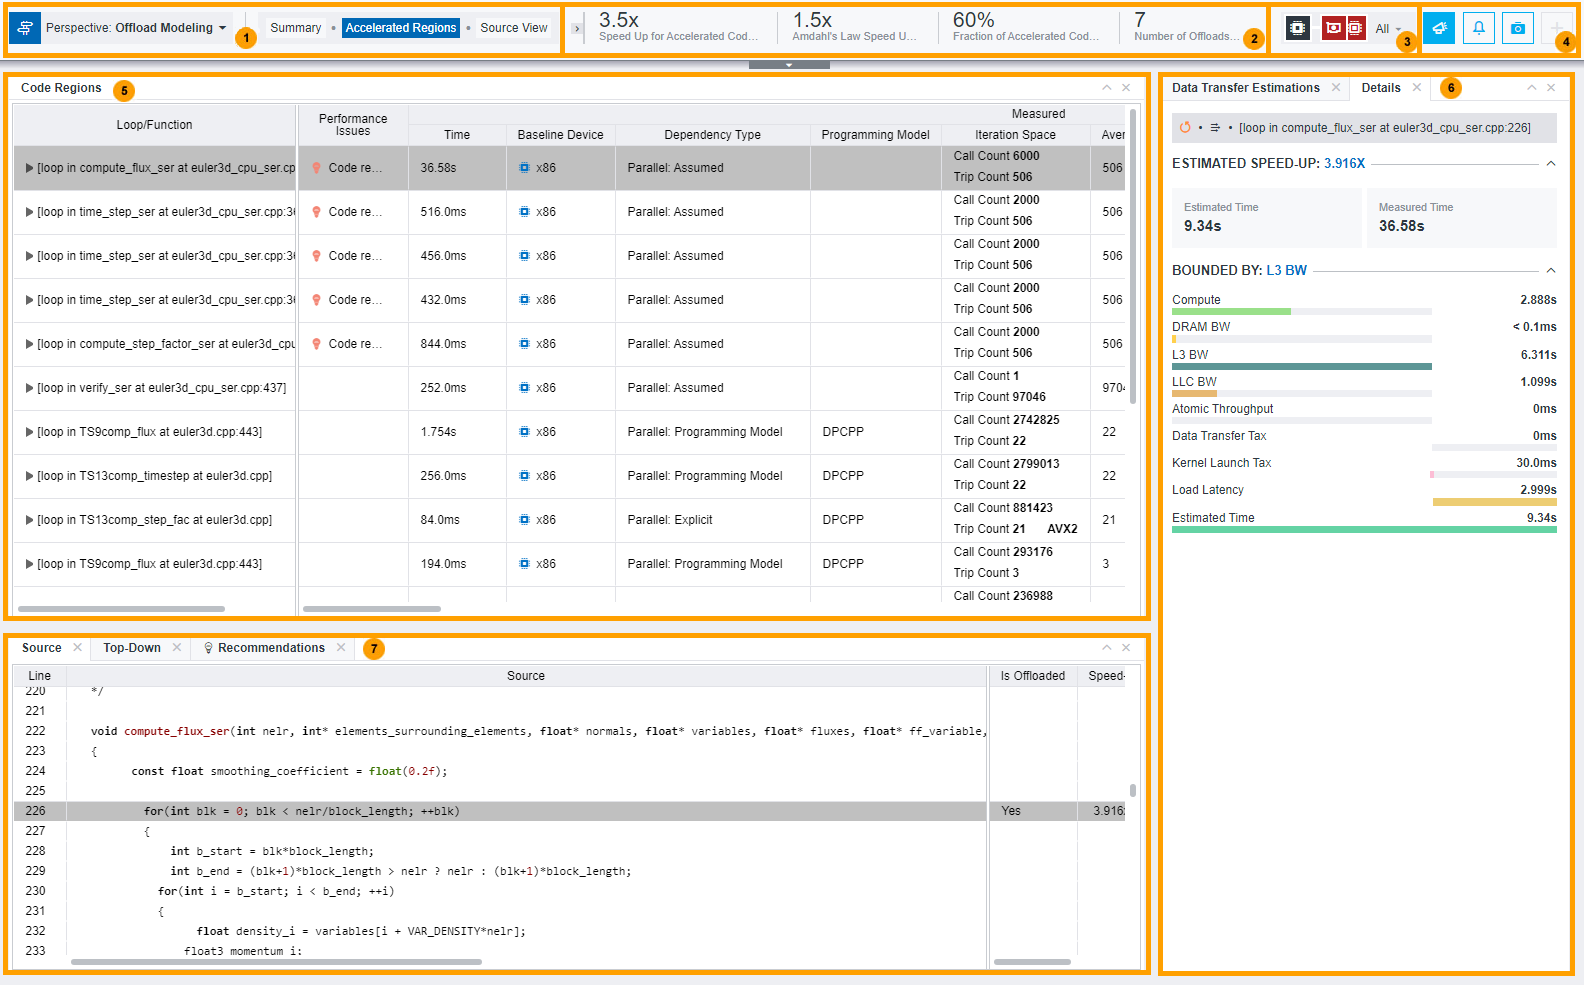
Window: Offload Modeling Report - Accelerated Regions
Use the Accelerated Regions window to view detailed information about offloaded and non-offloaded loops/functions, view source code for your loops/functions.
Review the controls available in the main report of the Offload Modeling perspective of the Intel® Advisor. In the Accelerated Regions and Summary reports, you can drag-and-drop, close/open, collapse/expand panes to change the report layout.
|
|
|
Review the summary offload characteristics for your application to decide if the application is recommended for offloading. The pane highlights total speedup, number of loops and functions offloaded, and a fraction of code accelerated. |
|
Select code regions to show in the report based on offload type:
|
|
|
|
Review the detailed information about your application performance measured on a host platform and its performance modeled on a target platform. For details about metrics reported, see Accelerator Metrics. Depending on a perspective configuration, you might see different metrics reported and some metrics might be not accurate. Refer to the following topics for interpretation details:
|
|
Switch between the Data Transfer Estimations tab and Details tab. In the Data Transfer Estimations tab, examine details about estimated data transfers in a loop and memory objects tracked and review data transfer recommendations. Select a loop in the Code Regions table to see the data transfer estimations for it. Click a recommendation to expand it and view hints for offloading your code to another accelerator, code samples, and links to useful resources. For details about how to read this pane, see Examine Data Transfers for Modeled Regions.
NOTE:
You need to enable data transfer analysis before running the perspective to see metrics in this pane,
In the Details tab, view performance metrics for a selected function/loop. |
|
Advanced view pane enables you to:
For details, see Examine Regions Recommended for Offloading |


 button.
  button. The top slider enables you to view the following:
 button to collapse the top slider or drag it to maximize the event log.
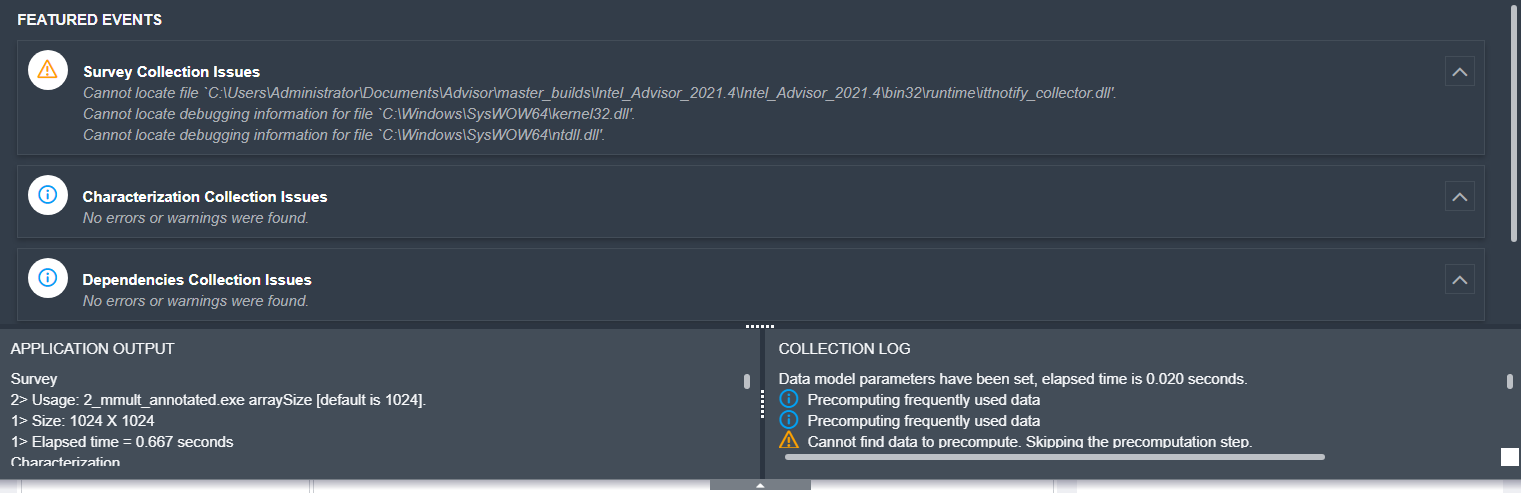
 button. For details, see

