Intel® Advisor User Guide

ID 766448
Date 12/16/2022
Public

A newer version of this document is available. Customers should click here to go to the newest version.

Document Table of Contents

Pane: GPU Roofline Chart

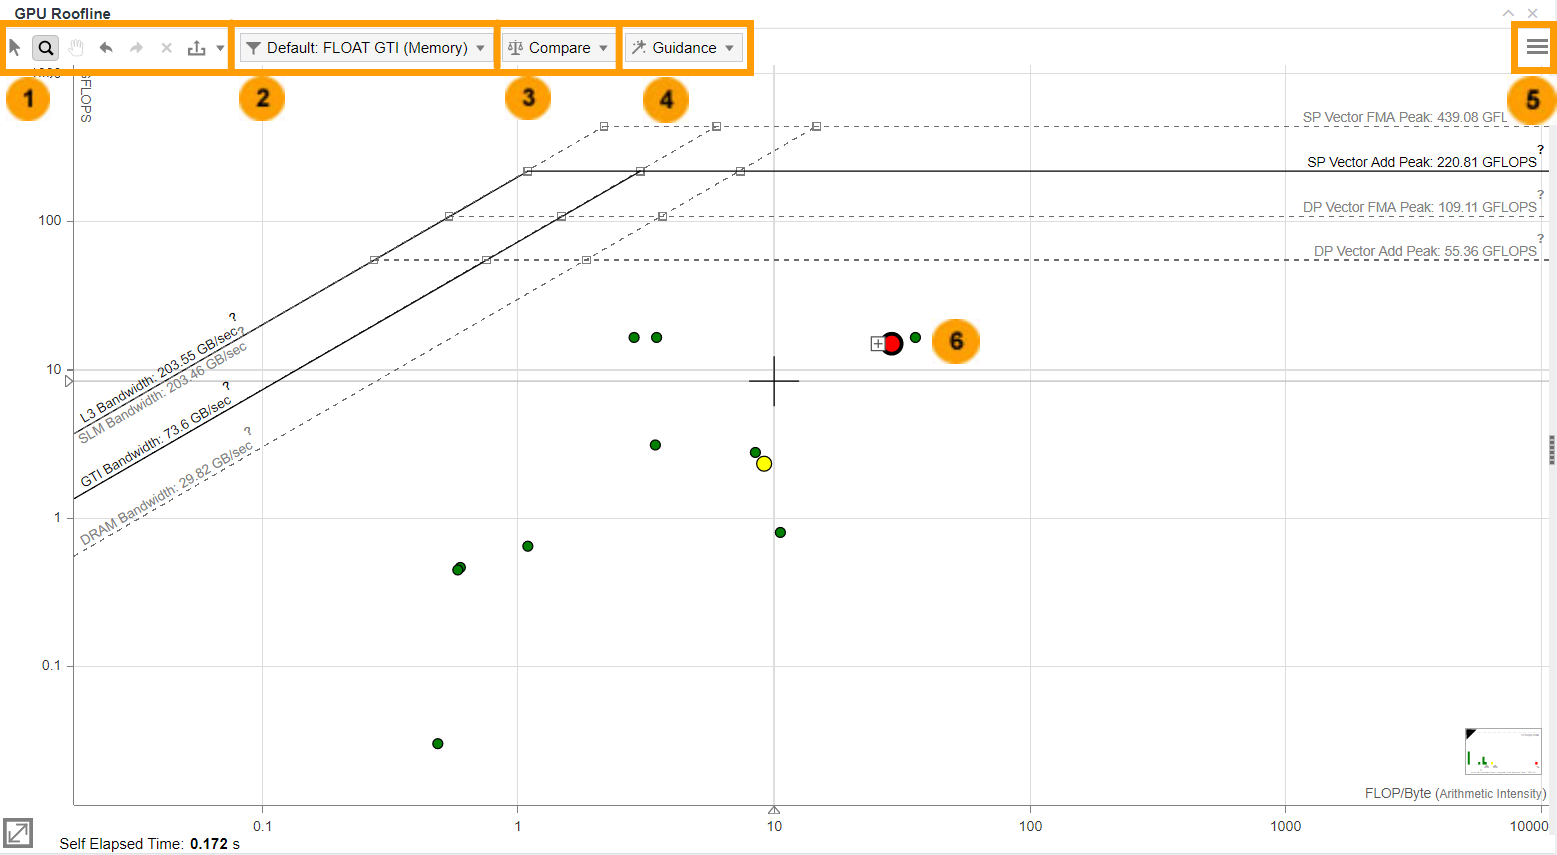
Use GPU Roofline chart to visualize actual performance of your GPU kernels against hardware-imposed performance ceilings. For more information about investigating GPU Roofline results, see Examine Bottlenecks on GPU Roofline Chart .

NOTE:
Families of Intel® Xe graphics products starting with Intel® Arc™ Alchemist (formerly DG2) and newer generations feature GPU architecture terminology that shifts from legacy terms. For more information on the terminology changes and to understand their mapping with legacy content, see GPU Architecture Terminology for Intel® Xe Graphics.

GPU Roofline Chart Controls

There are several controls to help you focus on the GPU Roofline chart data most important to you, including the following.

1

  • Select by Mouse Rect: Select one or more kernels by tracing a rectangle with your mouse.

  • Zoom by Mouse Rect: Zoom in and out by tracing a rectangle with your mouse. You can also zoom in and out using your mouse wheel.

  • Move View by Mouse: Move the chart left, right, up, and down.

  • Undo or Redo: Undo or redo the previous zoom action.

2

Use the filter drop-down to choose, which functions/loops to display on a Roofline chart. The following controls are available:

  • Use Operations pane to filter kernels by type of operations: INT or FLOAT.
  • Use the Memory Level pane to show results for each kernel in the chart: CARM, L3, SLM, GTI.

3

Use the Compare drop-down to plot results from another Roofline chart on results of your current project.

Click the button to add results for comparison.

View and switch between the files that are currently compared in the Compared Results pane.

After comparison, the recent results are saved. You can view the list of recent results in the Ready for Comparison pane.

4

Add visual Guidance to the GPU Roofline chart to make the interpretation of data easier, including performance limits and whether kernels are memory bound, compute bound, or both.

In the Guidance drop-down toolbar, use the Display roof rulers checkbox to enable showing a vertical line from a kernel to the nearest and topmost performance ceilings. To view the ruler, hover the cursor over a kernel dot. Where the line intersects with each roof, labels display hardware performance limits for the kernel.

The preview picture is updated as you select guidance options, allowing you to see how changes will affect the GPU Roofline chart's appearance. Click Apply to apply your changes or Default to return the GPU Roofline chart to its original appearance.

5

  • Roofline View Settings: Change the default scale setting to show:

    • The optimal scale (default), which adjusts to a chosen GPU Roofline chart view.

    • A constant scale, which adjusts to the tallest or widest view and does not change when a different GPU Roofline chart view is chosen.

  • Roof Settings: Change the visibility and appearance of roofline representations (lines):

    • Click a Visible checkbox to show/hide a roof line.

    • Click a Selected checkbox to change a roof line appearance: display the roof line as a solid or a dashed line.

    • Manually fine-tune roof values in the Value column to set hardware limits specific to your code.

  • Loop Weight Representation: Change the appearance of dots:

    • Point Weight Calculation: Change the Base Value for a point weight calculation.

      NOTE:
      For a GPU Roofline chart, only Self Elapsed Time is available as a base value.
    • Point Weight Ranges: Change the Size, Color, and weight Range of a dot. Click the + button to split a point weight range in two. Click the - button to merge a point weight range with the range below.

    • Point Colorization: Color dots by weight ranges or by type (vectorized or scalar). You can also change the color of loop with no self time.