Visible to Intel only — GUID: GUID-2AB21AC4-2F28-4D94-8EA4-F01EB8417F5D
Visible to Intel only — GUID: GUID-2AB21AC4-2F28-4D94-8EA4-F01EB8417F5D
View Data on Inline Functions
Configure the Intel® VTune™ Profiler data view to display the performance data per inline functions for applications in the Release configuration.
Requirements
This option is supported if you compile your code using:
- Linux*:
- GCC* compiler 4.1 (or higher)
- Intel® oneAPI DPC++/C++ Compiler. The -debug:inline-debug-info option is enabled by default if you compile with optimization level -O2 and higher, and if debugging is enabled with the -g option.
- Windows*:
- Intel® C++ Compiler Classic, with /debug:inline-debug-info option.
- Intel® oneAPI DPC++/C++ Compiler and Microsoft* Visual C++, with the /Zo option. The /Zo option is enabled by default when you generate debug information with /Zi or /Z7.
- Any other compiler that can generate debug information for inline functions in the DWARF format on Linux or Microsoft PDB format on Windows.
- JIT Profiling API is used for inline functions of JIT-compiled code.
View Inline Functions
To view data on inline functions, in the analysis result window, set the Inline Mode filer bar option to Show inline functions. VTune Profiler will display inline functions (virtual frames) as regular functions.
To disable displaying inline functions, select Hide inline functions.
Example 1: Inline Mode for Hotspots Analysis
In this example, you enable the Show inline functions option for the Hotspots analysis. This mode shows a full stack for the GetModelParams inline function:
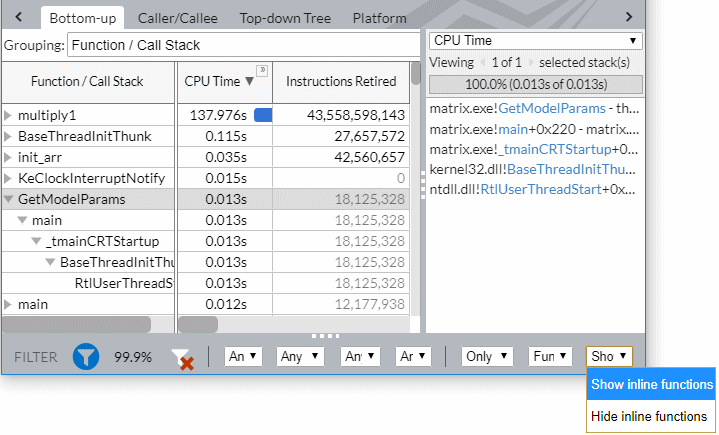
You can select the Source Function/Function/Call Stack level in the Grouping menu to view all instances of the inline function in one row.
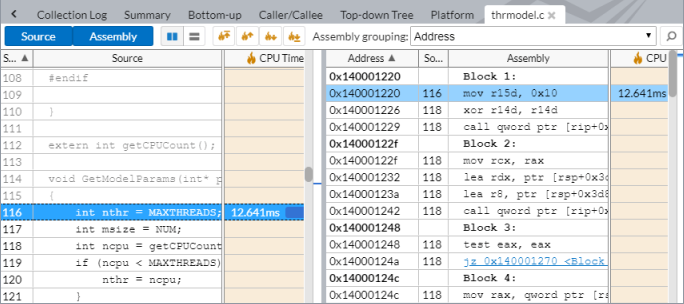
If you double-click the GetModelParams inline function, you can identify the code line that took the most CPU time and analyze the corresponding assembly code:
Example 2: Inline Mode for Hotspots analysis Disabled
When you select the Hide inline functions option on the filter bar for the same sample, the VTune Profiler does not show the GetModelParams function in the Bottom-up view:
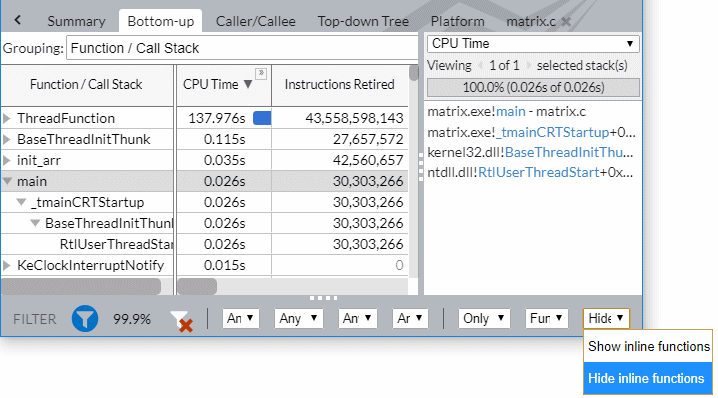
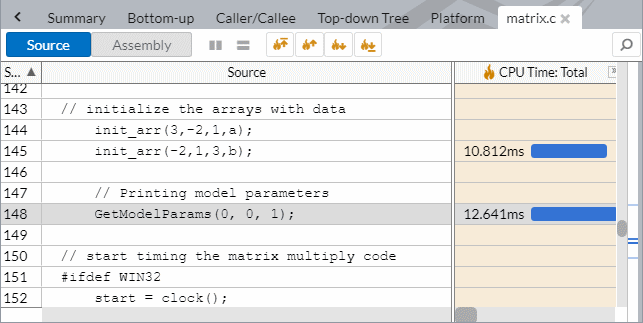
But if you double-click the main function entry and explore the source, you can see that all CPU time is attributed to the code line where the GetModelParams inline function is called:
Example 3: Inline Mode for GPU Compute/Media Hotspots
By default, the Inline Mode for GPU Compute/Media Hotspots analysis is disabled. In this example, 100% of GPU Cycles are attributed to the GPU_FFT_Global function:

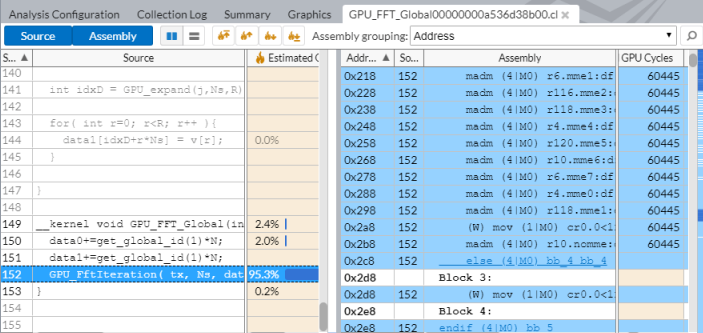
Double-clicking the GPU_FFT_Global source function opens the source view positioned on the code line invoking this function with 95.3% of Estimated GPU Cycles attributed to it:
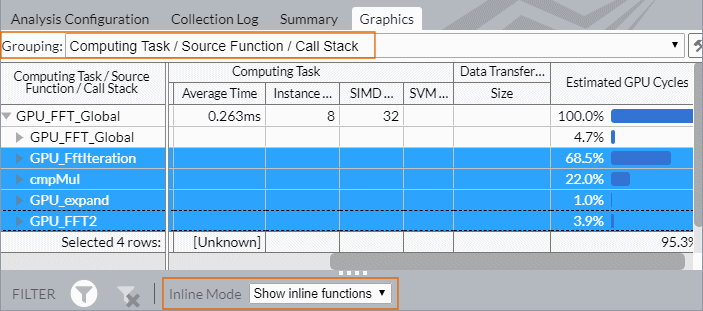
But if you select the Computing Task/Function/Call Stack or Computing Task/Source Function/Call Stack grouping level and enable the Inline Mode for this view, you see that the GPU_FFT_Global function took only 4.7% of the GPU Cycles, while four inline functions took the rest of cycles:
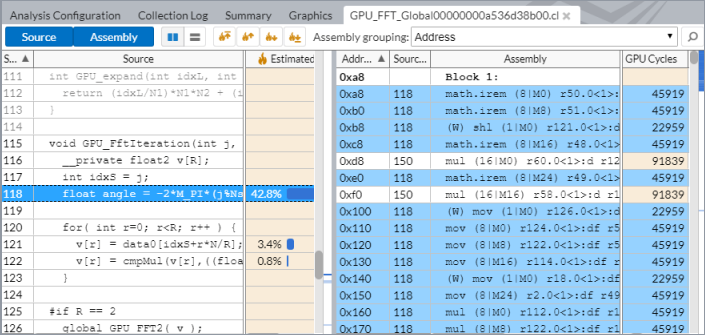
Double-click the hottest GPU_FftIteration function to analyze its source and assembly code:
