Visible to Intel only — GUID: GUID-F248F483-1D81-488F-8EE4-46EBBDDE6FA5
Visible to Intel only — GUID: GUID-F248F483-1D81-488F-8EE4-46EBBDDE6FA5
Analyze Latency Issues
Run the System Overview analysis in the Hardware Tracing mode to identify what caused latency issues in your application execution.
The System Overview viewpoint for Hardware Tracing collection provides the following data:
system-wide statistics over time with the microsecond granularity
module boundaries on the timeline
function names for module entry points
Active/Idle thread time
interrupts on the timeline
user-mode and kernel-mode execution times for modules and module entry points
You can use this data to:
Explore the Impact of Interrupts on the Application Elapsed Time
Open the Platform window to explore interrupts on the timeline view. The Interrupt Count chart provides a quick overview of the number of interrupts triggered during execution.
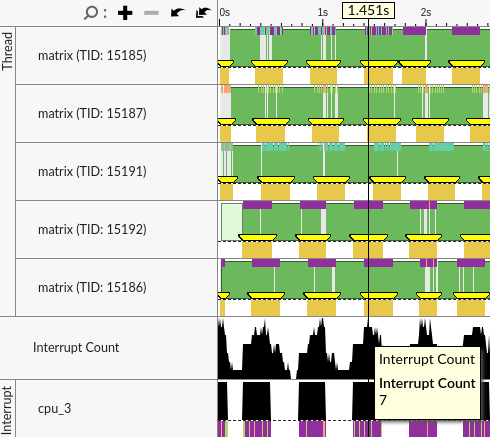
Locate the interrupt-intensive regions and zoom in. Hover over a module name to see the Module Entry Pont that discovers a cause for an interrupt. For example, a page fault:

Or a timer interrupt:

Analyze Thread Activity at the Microsecond Level
Hardware Tracing analysis enables you to analyze data at a high granularity level. This could be particularly useful, for example, to debug a network workload with a one-second duration between requests:

Zoom in to a single request. For example, the ping application measures and prints 250µs as reply time:

You can go deeper and analyze execution of each module:
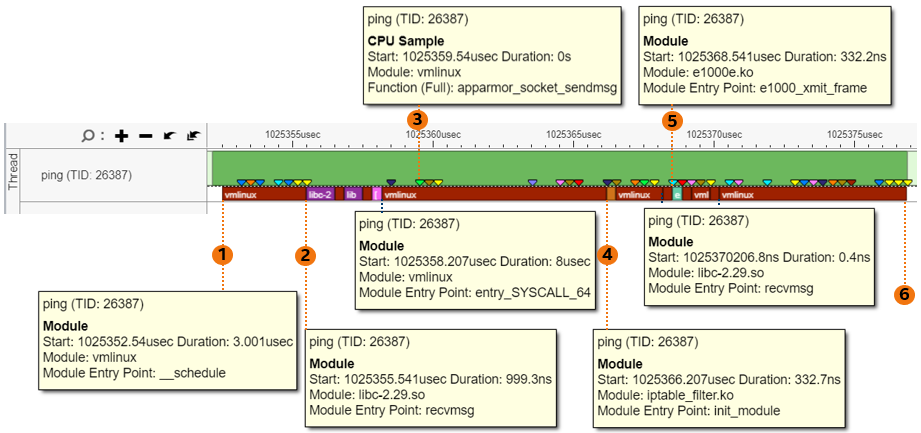
|
Explore Kernel Activity
The OS Scheduling Impact and OS Kernel Activity charts highlight regions where the system has performed multiple context switches and kernel-mode entries.
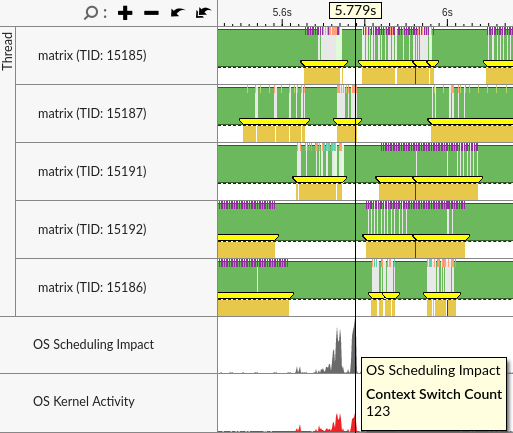
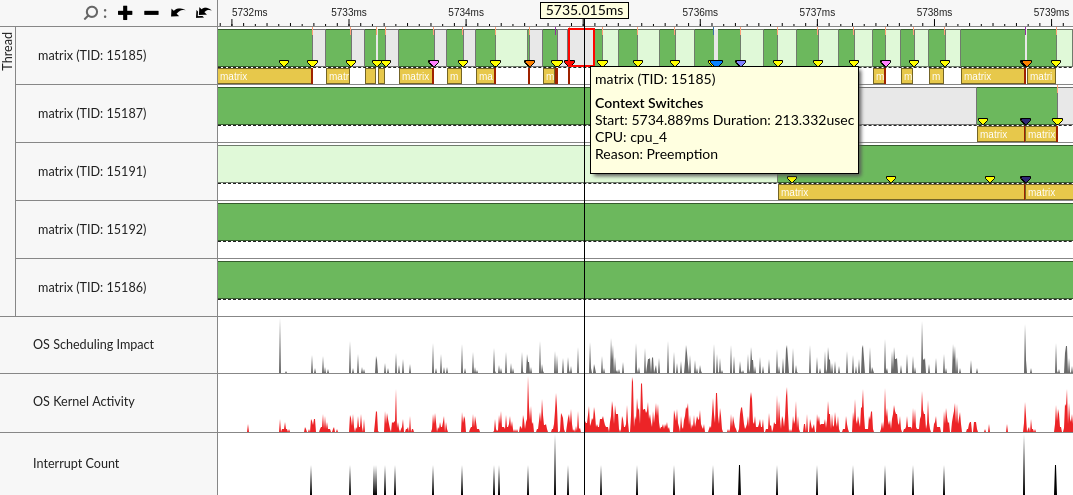
Locate a region with multiple context switches or high kernel activity and zoom in to investigate. For example, in this case the operating system has rescheduled a thread multiple times due to various reasons, including preemption and synchronization. Hover over the markers to get additional details and to determine the root cause of the issue.
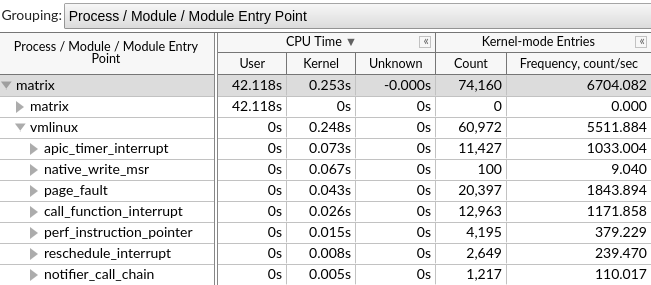
In the grid pane of the Platform window, use the Process / Module / Module Entry Point grouping to get a detailed view of user-mode and kernel activity. Expand a module and study the module entry points to determine the amount of time spent by the module in the kernel mode.
You can also examine the number and frequency of Kernel-mode Entries caused by a specific module and function to determine the performance impact of kernel activity.
Hardware Tracing collection is more precise than event-based sampling and provides all the modules executed with their precise time.


