Visible to Intel only — GUID: GUID-56D02FC5-D31F-4E6A-B661-28EB50DD63B8
Visible to Intel only — GUID: GUID-56D02FC5-D31F-4E6A-B661-28EB50DD63B8
.NET* Targets
Explore performance analysis specifics for pure .NET* applications or native applications with .NET calls.
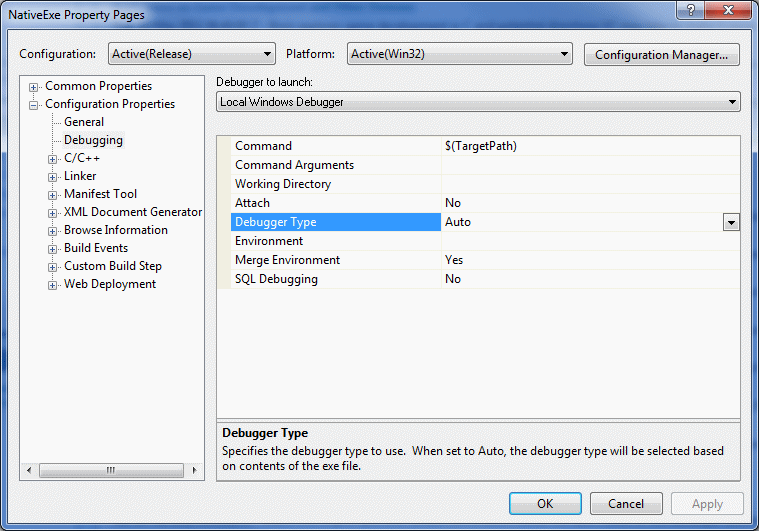
Intel® VTune™ Profiler automatically identifies the type of the code based on the debugger type specified in the Visual Studio project property pages:

VTune Profiler inherits this setting to set the profiling mode for the analysis target. The following types are possible:
Native mode collects data on native code only, does not attribute data to managed source.
Managed mode collects everything, resolves samples attributed to native code, attributes data to managed source only. The call stack in the analysis result displays data for managed code only.
Mixed collects everything and attributes data to managed source where appropriate. Consider using this option when analyzing a native executable that makes calls to the managed code.
Auto mode automatically detects the type of target executable, managed or native, and switches to the corresponding mode.
Profiling Pure .NET Applications
If you analyze a pure .NET application, the VTune Profiler resolves the Auto mode to Mixed.
Before profiling a pure .NET application, make sure to generate debug information for a native image of .NET managed assembly, which is required for successful module resolution and source analysis:
Use the Native Image Generator tool (Ngen.exe) from the .NET Framework to generate a native .pdb file.
Click the
 Configure Analysis button on the toolbar.
 In the Configure Analysis window, click the
 Search Binaries button at the bottom.
 In the Binary/Symbol Search dialog box, add a path to the generated native .pdb file.
Profiling Native Applications with .NET Calls
If you analyze a native application that calls managed code, the VTune Profiler resolves the Auto mode to Native and does not profile managed code. In this case, if you want to enable the VTune Profiler to profile the managed code called from the native application, set the profiling mode to Mixed as follows:
Click the
 Configure Analysis button on the toolbar.
 The Configure Analysis window opens.
De-select the Inherit settings from Visual Studio* project check box.
The Managed code profiling mode option is enabled.
In the WHAT pane, from the Advanced > Managed code profiling mode menu, select the required profiling mode.
System-wide profiling is not supported for managed code.
Starting with the VTune Amplifier 2018 Update 2, you can use the Hotspots analysis in the hardware event-based sampling mode (former Advanced Hotspots) to profile .Net Core applications running on Linux* or Windows* systems in the Launch Application mode. For the product versions prior to 2018 Update 2, make sure to manually configure CoreCRL environment variables to enable the Advanced Hotspots analysis.