Visible to Intel only — GUID: irs1568053964166
Ixiasoft
Visible to Intel only — GUID: irs1568053964166
Ixiasoft
8.3.1.3. Dashboard View
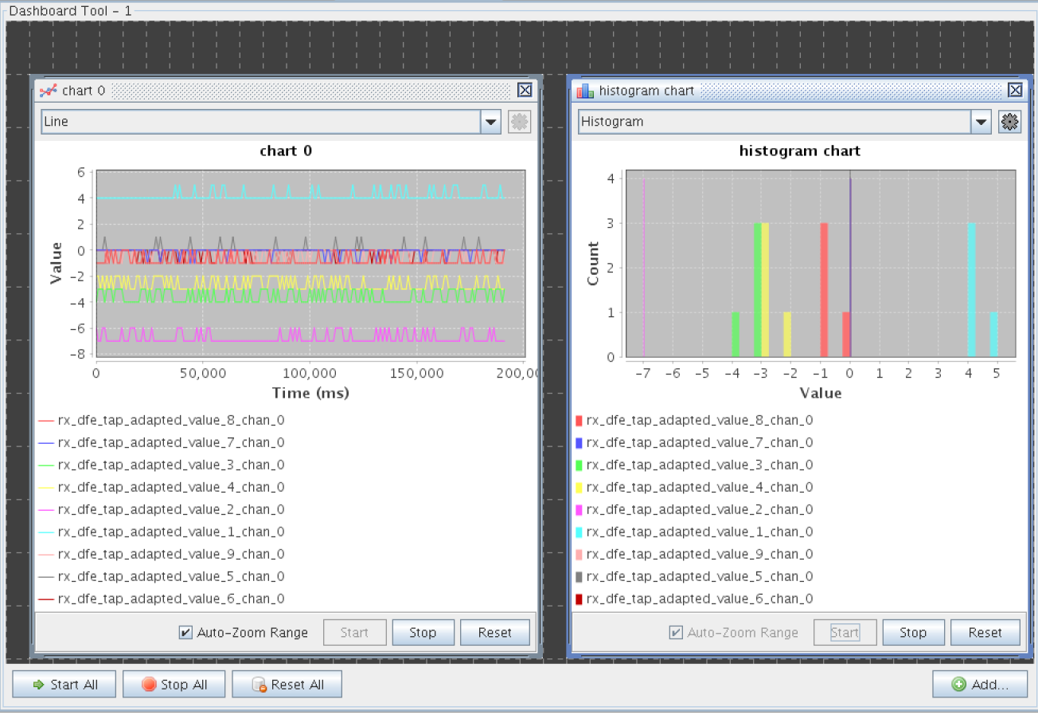
The Dashboard provides options to view a line chart, histogram, pie chart or bar graph, and a data history. There is no limit imposed on the number of instances of the Dashboard view open at once. However, a performance penalty occurs if you update a high number of parameters at a high frequency simultaneously.

The Add Parameter dialog box opens when you click the Add button. Only those parameters that declare the allows_charting parameter property are available for selection in the Add Parameter dialog box.