Visible to Intel only — GUID: kcs1492550217964
Ixiasoft
Visible to Intel only — GUID: kcs1492550217964
Ixiasoft
5.3.10.1. Data Log Pane
- To save the current configuration or capture in the Data Log—and .stp file, click Edit > Save to Data Log. Alternatively, click the Save to Data Log icon
 at the top of the Data Log pane.
 - To generate a log entry after every data capture, click Edit > Enable Data Log. Alternatively, check the box at the top of the Data Log pane.
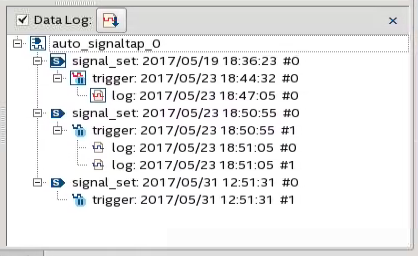
The Data Log displays its contents in a tree hierarchy. The active items display a different icon.
| Item | Icon | Contains one or more | Comments | |
|---|---|---|---|---|
| Unselected | Selected | |||
| Instance | |
|
Signal Set | |
| Signal Set | |
|
Trigger | The Signal Set changes whenever you add a new signal to Signal Tap. After a change in the Signal Set, you need to recompile. |
| Trigger | |
|
Capture Log | A trigger changes when you change any trigger condition. These changes do not require recompilation. |
| Capture Log | |
|
||
The name on each entry displays the wall-clock time when Signal Tap Logic Analyzer triggered, and the time elapsed from start acquisition to trigger activation. You can rename entries so they make sense to you.
To switch between configurations, double-click an entry in the Data Log. As a result, the Setup tab updates to display the active signal list and trigger conditions.
Simple Data Log
On this example, the Data Log displays one instance with three signal set configurations.
