External Memory Interfaces Intel® Agilex™ FPGA IP Design Example User Guide
ID
683162
Date
6/21/2021
Public
A newer version of this document is available. Customers should click here to go to the newest version.
Visible to Intel only — GUID: kkm1581530753523
Ixiasoft
1. About the External Memory Interfaces Intel® Agilex™ FPGA IP
2. Design Example Quick Start Guide for External Memory Interfaces Intel® Agilex™ FPGA IP
3. Design Example Description for External Memory Interfaces Intel® Agilex™ FPGA IP
4. External Memory Interfaces Intel® Agilex™ FPGA IP Design Example User Guide Archives
5. Document Revision History for External Memory Interfaces Intel® Agilex™ FPGA IP Design Example User Guide
2.1. Creating an EMIF Project
2.2. Generating and Configuring the EMIF IP
2.3. Generating the Synthesizable EMIF Design Example
2.4. Generating the EMIF Design Example for Simulation
2.5. Simulation Versus Hardware Implementation
2.6. Simulating External Memory Interface IP With ModelSim
2.7. Pin Placement for Intel® Agilex™ EMIF IP
2.8. Compiling and Programming the Intel® Agilex™ EMIF Design Example
2.9. Generating a Design Example with the Calibration Debug Option
2.10. Generating a Design Example with the TG Configuration Option
2.11. Using the Design Example with the EMIF Debug Toolkit
Visible to Intel only — GUID: kkm1581530753523
Ixiasoft
2.11. Using the Design Example with the EMIF Debug Toolkit
Before launching the EMIF Debug Toolkit, ensure that you have configured your device with a programming file that has the EMIF Debug Toolkit enabled. To launch the EMIF Debug Toolkit, follow these steps:
- In the Intel® Quartus® Prime software, open the System Console by selecting Tools > System Debugging Tools > System Console.
- [Skip this step if your project is already open in the Intel® Quartus® Prime software.] In the System Console, load the SRAM object file (.sof) with which you programmed the board (as described in Prerequisites for Using the EMIF Debug Toolkit, in the External Memory Interfaces Intel® Agilex™ FPGA IP User Guide).
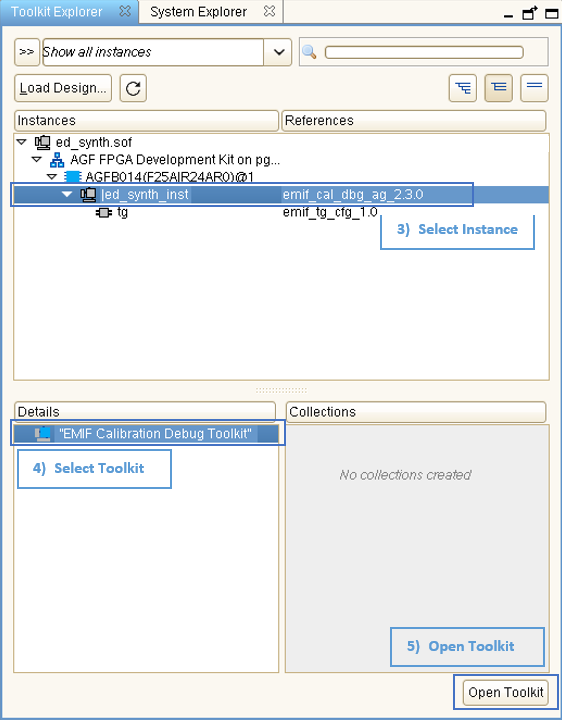
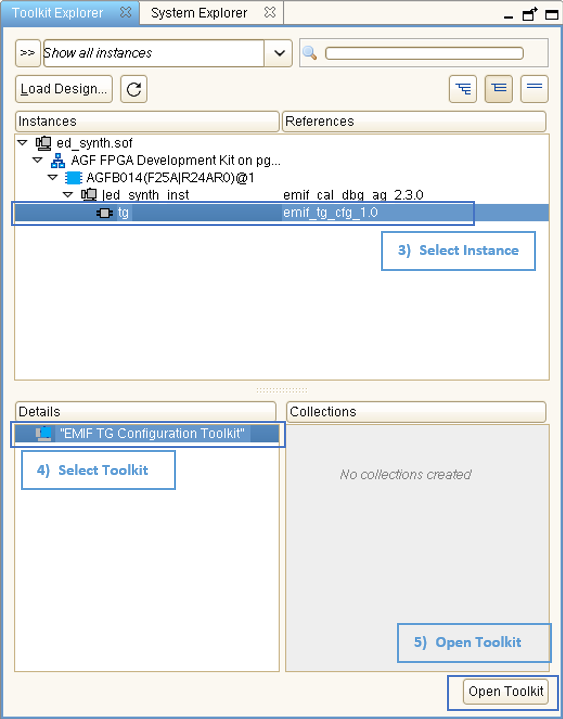
- Select instances to debug.
- Select EMIF Calibration Debug Toolkit for EMIF calibration debugging, as described in Generating a Design Example with the Calibration Debug Option . Alternatively, select EMIF TG Configuration Toolkit for traffic generator debugging, as described in Generating a Design Example with the TG Configuration Option .
- Click Open Toolkit to open the main view of the EMIF Debug Toolkit.
- If there are multiple EMIF instances in the programmed design, select the column (path to JTAG master) and memory interface ID of the EMIF instance for which to activate the toolkit.

- Click Activate Interface to allow the toolkit to read the interface parameters and calibration status.

- You must debug one interface at a time; therefore, to connect to another interface in the design, you must first deactivate the current interface.

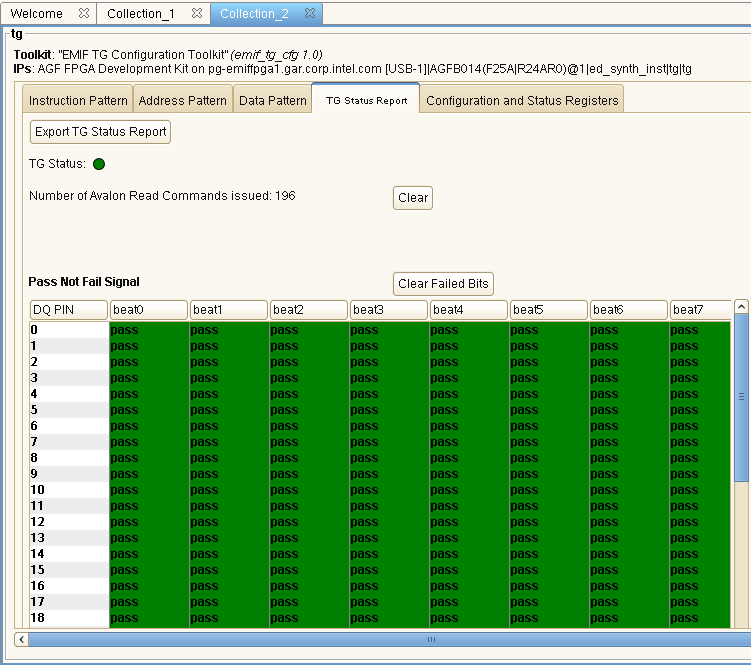
The following are examples of reports from the EMIF Calibration Debug Toolkit and the EMIF TG Configuration Toolkit:, respectively
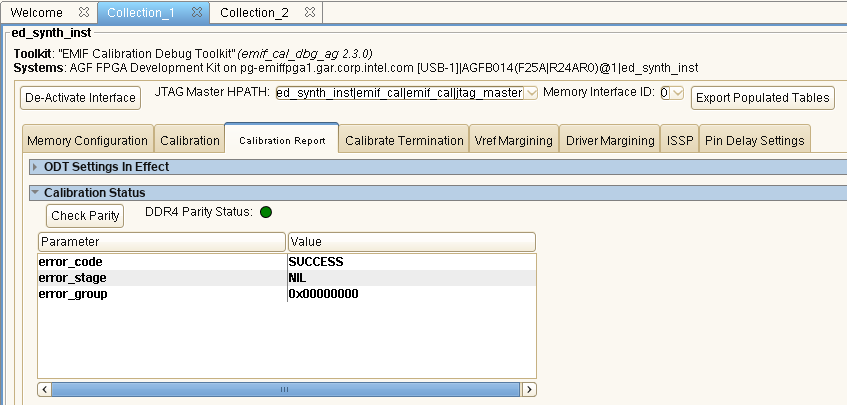


Note: For details on calibration debugging, refer to Debugging with the External Memory Interface Debug Toolkit, in the External Memory Interfaces Intel® Agilex™ FPGA IP User Guide.
Note: For details on traffic generator debugging, refer to Traffic Generator Configuration User Interface, in the External Memory Interfaces Intel® Agilex™ FPGA IP User Guide.