Visible to Intel only — GUID: GUID-B03EC41C-A045-4BAD-9861-E0D5BBCB021D
Special Naming Convention for Certain QuickWin and Windows* Graphics Routines
Comparing QuickWin with Windows*-Based Applications
Using Windows API Routines with QuickWin
Types of QuickWin Programs
The QuickWin User Interface
USE Statement Needed for Fortran QuickWin Applications
Creating QuickWin Windows
Using QuickWin Graphics Library Routines
Selecting Display Options
Checking the Current Graphics Mode
Setting the Graphics Mode
Setting Figure Properties
Understanding Coordinate Systems
Adding Color
Writing a Graphics Program
Displaying Graphics Output
Storing and Retrieving Images
Customizing QuickWin Applications
QuickWin Programming Precautions
Simulating Nonblocking I/O
Visible to Intel only — GUID: GUID-B03EC41C-A045-4BAD-9861-E0D5BBCB021D
Real Coordinates Sample Program
The program REALG.F90 shows how to create multiple window-coordinate sets, each in a separate viewport, on a single screen.
! REALG.F90 (main program) - Illustrates coordinate graphics.
  !
     USE IFQWIN
     LOGICAL              statusmode
     TYPE (windowconfig)  myscreen
     COMMON               myscreen
  !
  !   Set the screen to the best resolution and maximum number of
  !   available colors.
     myscreen.numxpixels  = -1
     myscreen.numypixels  = -1
     myscreen.numtextcols = -1
     myscreen.numtextrows = -1
     myscreen.numcolors   = -1
     myscreen.fontsize    = -1
     myscreen.title       = " "C
     statusmode = SETWINDOWCONFIG(myscreen)
     IF(.NOT. statusmode) statusmode = SETWINDOWCONFIG(myscreen)
     statusmode = GETWINDOWCONFIG( myscreen )
     CALL threegraphs( )
     END
     .
     .
     .
The main body of the program is very short. It sets the window to the best resolution of the graphics driver (by setting the first four fields to -1) and the maximum number of colors (by setting numcolors to -1). The program then calls the threegraphs subroutine that draws three graphs. The program output is shown in the following figure:
REALG Program Output
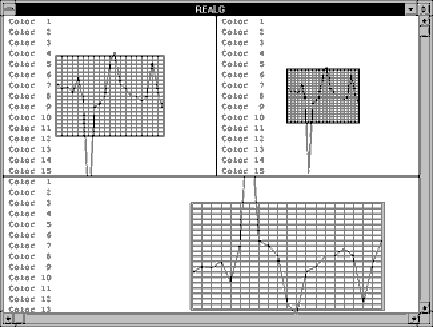
The gridshape subroutine, which draws the graphs, uses the same data in each case. However, the program uses three different coordinate windows.
The two viewports in the top half are the same size in physical coordinates, but have different window sizes. Each window uses different maximum and minimum values. In all three cases, the graph area is two units wide. The window in the upper-left corner has a range in the x-axis of four units (4 units wide); the window in the upper-right corner has a range in the x-axis of six units, which makes the graph on the right appear smaller.
In two of the three graphs, one of the lines goes off the edge, outside the clipping region. The lines do not intrude into the other viewports, because defining a viewport creates a clipping region.
Finally, the graph on the bottom inverts the data with respect to the two graphs above it.
The next section describes and discusses the subroutine invoked by REALG.F90:
Drawing the Graphs
The main program calls threegraphs, which prints the three graphs:
  SUBROUTINE threegraphs()
   USE IFQWIN
   INTEGER(2)           status, halfx, halfy
   INTEGER(2)           xwidth, yheight, cols, rows
   TYPE (windowconfig)  myscreen
   COMMON               myscreen
   CALL CLEARSCREEN( $GCLEARSCREEN )
   xwidth  = myscreen.numxpixels
   yheight = myscreen.numypixels
   cols    = myscreen.numtextcols
   rows    = myscreen.numtextrows
   halfx   = xwidth / 2
   halfy   = (yheight / rows) * ( rows / 2 )
 !
 !  First window
 !
   CALL SETVIEWPORT( INT2(0), INT2(0), halfx - 1, halfy - 1 )
   CALL SETTEXTWINDOW( INT2(1), INT2(1), rows / 2, cols / 2 )
   status = SETWINDOW( .FALSE., -2.0_8, -2.0_8, 2.0_8, 2.0_8 )
 !  The 2.0_8 notation makes these constants REAL(8)
   CALL gridshape( rows / 2 )
   status = RECTANGLE( $GBORDER,INT2(0),INT2(0),halfx-1,halfy-1 )
 !
 !  Second window
 !
   CALL SETVIEWPORT( halfx, INT2(0), xwidth - 1, halfy - 1 )
   CALL SETTEXTWINDOW( INT2(1), (cols/2) + 1, rows/2, cols )
   status = SETWINDOW( .FALSE., -3.0D0, -3.0D0, 3.0D0, 3.0D0 )
 !  The 3.0D0 notation makes these constants REAL(8)
   CALL gridshape( rows / 2 )
   status = RECTANGLE_W( $GBORDER, -3.0_8,-3.0_8,3.0_8, 3.0_8 )
 !
 !  Third window
 !
   CALL SETVIEWPORT( 0, halfy, xwidth - 1, yheight - 1 )
   CALL SETTEXTWINDOW( (rows / 2 ) + 1, 1_2, rows, cols )
   status = SETWINDOW( .TRUE., -3.0_8, -1.5_8, 1.5_8, 1.5_8 )
   CALL gridshape( INT2( (rows / 2) + MOD( rows, INT2(2) ) ) )
   status = RECTANGLE_W( $GBORDER, -3.0_8, -1.5_8, 1.5_8, 1.5_8 )
  END SUBROUTINE
Although the screen is initially clear, threegraphs makes sure by calling the CLEARSCREEN routine to clear the window:
CALL CLEARSCREEN( $GCLEARSCREEN )
The $GCLEARSCREEN constant clears the entire window. Other options include $GVIEWPORT and $GWINDOW, which clear the current viewport and the current text window, respectively.
After assigning values to some variables, threegraphscreates the first window:
  CALL SETVIEWPORT( INT2(0), INT2(0), halfx - 1, halfy - 1 )
  CALL SETTEXTWINDOW( INT2(1), INT2(1), rows / 2, cols / 2 )
  status = SETWINDOW( .FALSE., -2.0_8, -2.0_8, 2.0_8, 2.0_8 )
The first instruction defines a viewport that covers the upper-left quarter of the screen. The next instruction defines a text window within the boundaries of that border. Finally, the third instruction creates a window with both x and y values ranging from -2.0 to 2.0. The .FALSE. constant causes the y-axis to increase from top to bottom, which is the default. The _8 notation identifies the constants as REAL(8).
Next, the function gridshape inserts the grid and plots the data, and a border is added to the window:
  CALL gridshape( rows / 2 )
  status = RECTANGLE( $GBORDER,INT2(0),INT2(0),halfx-1,halfy-1 )
This is the standard RECTANGLE routine, which takes coordinates relative to the viewport, not the window.
The gridshape subroutine plots the data on the screen.
 ! GRIDSHAPE - This subroutine plots data for REALG.F90
 !
  SUBROUTINE gridshape( numc )

   USE IFQWIN
   INTEGER(2)           numc, i, status
   INTEGER(4)           rgbcolor, oldcolor
   CHARACTER(8)         str
   REAL(8)              bananas(21), x
   TYPE (windowconfig)  myscreen
   TYPE (wxycoord)      wxy
   TYPE (rccoord)       curpos
   COMMON               myscreen
  !
  !  Data for the graph:
  !
    DATA bananas / -0.3, -0.2, -0.224, -0.1, -0.5, 0.21, 2.9, &
    & 0.3, 0.2, 0.0, -0.885, -1.1, -0.3, -0.2, &
    & 0.001, 0.005, 0.14, 0.0, -0.9, -0.13, 0.31 /
  !
  !  Print colored words on the screen.
  !
    IF(myscreen.numcolors .LT. numc) numc = myscreen.numcolors-1
    DO i = 1, numc
        CALL SETTEXTPOSITION( i, INT2(2), curpos )
        rgbcolor = 12**i -1
        rgbcolor = MODULO(rgbcolor, #FFFFFF)
        oldcolor = SETTEXTCOLORRGB( rgbcolor )
        WRITE ( str, '(I8)' ) rgbcolor
        CALL OUTTEXT( 'Color ' // str )
    END DO
  !
  !  Draw a double rectangle around the graph.
  !
    oldcolor = SETCOLORRGB( #0000FF ) ! full red
    status = RECTANGLE_W( $GBORDER, -1.00_8, -1.00_8, 1.00_8,1.00_8 )
  ! constants made REAL(8) by appending _8
    status = RECTANGLE_W( $GBORDER, -1.02_8, -1.02_8, 1.02_8, 1.02_8 )
  !
  !  Plot the points.
  !
    x = -0.90
    DO i = 1, 19
        oldcolor = SETCOLORRGB( #00FF00 ) ! full green
        CALL MOVETO_W( x, -1.0_8, wxy )
        status = LINETO_W( x, 1.0_8 )
        CALL MOVETO_W( -1.0_8, x, wxy )
        status = LINETO_W( 1.0_8, x )
        oldcolor = SETCOLORRGB( #FF0000 ) ! full blue
        CALL MOVETO_W( x - 0.1_8, bananas( i ), wxy )
        status = LINETO_W( x, bananas( i + 1 ) )
        x = x + 0.1
    END DO
    CALL MOVETO_W( 0.9_8, bananas( i ), wxy )
    status = LINETO_W( 1.0_8, bananas( i + 1 ) )
    oldcolor = SETCOLORRGB( #00FFFF ) ! yellow
  END SUBROUTINE
The routine names that end with _W work in the same way as their viewport equivalents, except that you pass double-precision floating-point values instead of integers. For example, you pass INTEGER(2) to LINETO, but REAL(8) values to LINETO_W.
The two other windows are similar to the first. All three call the gridshape function, which draws a grid from location (-1.0, -1.0) to (1.0, 1.0). The grid appears in different sizes because the coordinates in the windows vary. The second window ranges from (-3.0, -3.0) to (3.0, 3.0), and the third from (-3.0, -1.5) to (1.5, 1.5), so the sizes change accordingly.
The third window also contains a .TRUE. inversion argument. This causes the y-axis to increase from bottom to top, instead of top to bottom. As a result, this graph appears upside down with respect to the other two.
After calling gridshape, the program frames each window, using a statement such as the following:
status = RECTANGLE_W( $GBORDER, -3.0_8, -1.5_8, 1.5_8, 1.5_8 )
The first argument is a fill flag indicating whether to fill the rectangle's interior or just to draw its outline. The remaining arguments are the x and y coordinates for the upper-left corner followed by the x and y coordinates for the lower-right corner.RECTANGLE takes integer arguments that refer to the viewport coordinates.RECTANGLE_W takes four double-precision floating-point values referring to window coordinates.
After you create various graphics elements, you can use the font-oriented routines to polish the appearance of titles, headings, comments, or labels. Using Fonts from the Graphics Library Overview describes in more detail how to print text in various fonts with font routines.
Parent topic: Understanding Coordinate Systems