Visible to Intel only — GUID: GUID-0D55091C-D0A4-448C-9A0A-98A8DB3369F2
Visible to Intel only — GUID: GUID-0D55091C-D0A4-448C-9A0A-98A8DB3369F2
Collect Traces In the Flow Graph Analyzer GUI
To run an existing Intel® oneAPI Threading Building Blocks (oneTBB) application and collect execution trace information for analysis, you can launch the TBB trace collector feature from the Flow Graph Analyzer GUI as follows, assuming the paths for the oneTBB libraries are set up (see Release Notes and Known Issues for limitations):
Run the trace collector using one of the following options:
Go to the Offload Actions > Run and collect traces menu option.
Click the Run and Collect Traces
 icon on the toolbar.
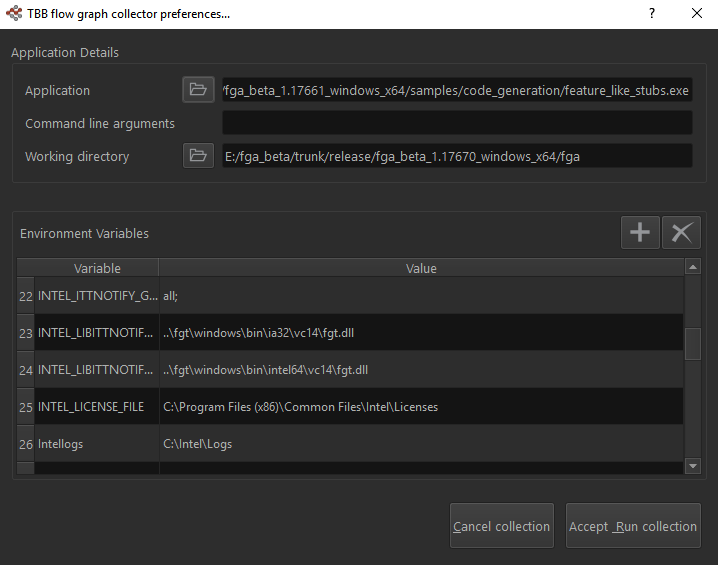
The collector Preferences window opens, which lets you specify the application to run:

In the collector Preferences window:
Specify an application to run in the Application field.
Optional: Change the Working Directory value if required. The default is the Flow Graph Analyzer directory.
View and set other environment variables, including INTEL_LIBITTNOTIFY32 and INTEL_LIBITTNOTIFY64, using the Environment Variables pane of the dialog box.
The environment variables for running trace collection have default settings if you did not change their values in the environment from which the Flow Graph Analyzer is launched. The inherited values are used if the environment variables are set in the environment.
OS
Environment Variable
Default Value
Description
Windows*
INTEL_LIBITTNOTIFY32
..\fgt\windows\bin\ia32\vc14.1\fgt.dll
32-bit collector library
INTEL_LIBITTNOTIFY64
..\fgt \windows\bin\intel64\vc14.1\fgt.dll
64-bit collector library
INTEL_ITTNOTIFY_GROUPS
all;
Trace events from all groups
Linux*
INTEL_LIBITTNOTIFY32
../fgt/linux/lib/ia32/cc4.8_libc2.19_kernel3.13.0/libfgt.so
32-bit collector library
INTEL_LIBITTNOTIFY64
../fgt/linux/lib/intel64/cc4.8_libc2.19_kernel3.13.0/libfgt.so
64-bit collector library
INTEL_ITTNOTIFY_GROUPS
all;
Trace events from all groups
macOS*
INTEL_LIBITTNOTIFY32
../fgt/macos/lib/ia32/osx10.12.6_kernel16.7.0/libfgt.dylib
32-bit collector library
INTEL_LIBITTNOTIFY64
../fgt/macos/lib/intel64/osx10.12.6_kernel16.7.0/libfgt.dylib
64-bit collector library
INTEL_ITTNOTIFY_GROUPS
all;
Trace events from all groups
Click the Accept Run collection button. If the application is executed correctly, the trace files are converted to a GraphML* format. The output file is stored in the working directory with a name based on the executable name and the time of the trace collection run.
To examine the trace file, load the GraphML* file into the Flow Graph Analyzer GUI manually.