Identify Code Regions to Offload to GPU and Visualize GPU Usage
This recipe explains how to identify regions to offload to the GPU, visualize performance of GPU kernels, and identify bottlenecks in your application using the Offload Modeling and the GPU Roofline Insights features of the Intel® Advisor.
Scenario
Some of the most common problems in today's computer science domain - such as artificial intelligence, simulation, and modeling - involve matrix multiplication. The algorithm is a triply-nested loop with a multiply and an add operation for each iteration. It is computationally intensive and it also accesses a lot of memory.
Ingredients
This section lists the hardware and software used to produce the specific result shown in this recipe:
Performance analysis tools: Intel® Advisor
The latest version is available for download at: https://www.intel.com/content/www/us/en/developer/tools/oneapi/advisor.html.
Application: Standard C++ matrix multiply as indicated in the Scenario section.
Not available for download.
Compilers: Intel® oneAPI DPC++/C++ Compiler
The latest version of the Intel® oneAPI DPC++/C++ Compiler is available for download at https://www.intel.com/content/www/us/en/developer/tools/oneapi/dpc-compiler.html.
Operating system: Ubuntu* 18.04
CPU: Intel® Core™ i7-7500U processor
Identify Regions to Offload to GPU with Offload Modeling
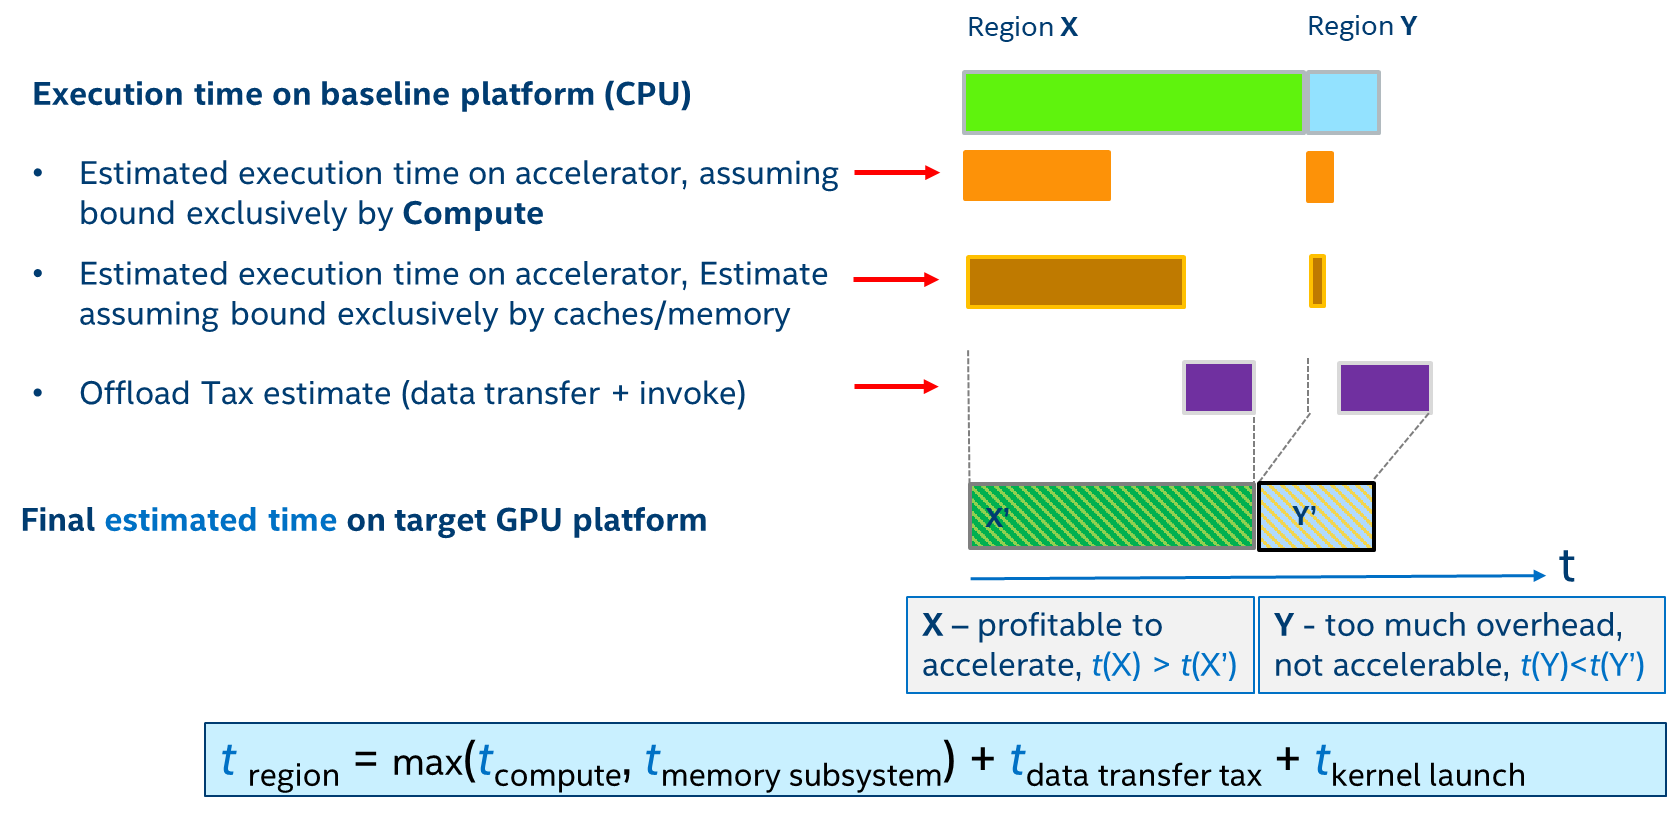
Use the Offload Modeling feature of the Intel Advisor to identify the portions of a code that are profitable to be offloaded to a GPU. Offload Modeling can predict the code's performance if run on a GPU and lets you experiment with accelerator configuration parameters.
The Intel Advisor produces upper-bound speedup estimates using a bounds and bottlenecks performance model. It takes measured x86 CPU metrics and application characteristics as an input and applies an analytical model to estimate execution time and speedup on a target GPU.

Prerequisites: Set up the Intel Advisor environment variables to enable the command line interface (CLI):
source <advisor-install-dir>/advisor-vars.sh
To analyze your code with the Offload Modeling:
Collect application performance metrics with Survey analysis:
advisor --collect=survey --project-dir=./mmult --stackwalk-mode=online --static-instruction-mix -- /home/test/mmult
Collect Trip Counts and FLOP data:
advisor --collect=tripcounts --project-dir=./mmult --flop --target-device=gen9_gt2 -- /home/test/mmult
Model the application performance for a gen9_gt2 configuration:
advisor --collect=projection --project-dir=./mmult --config=gen9_gt2 --no-assume-dependencies
NOTE:In the Intel Advisor GUI, this corresponds to a low-accuracy configuration of the Offload Modeling. See User Guide: Offload Modeling Accuracy Presets for details.Go to mmult/e000/pp000/data.0 and open the interactive HTML report report.html in a web browser to see the performance projection results.

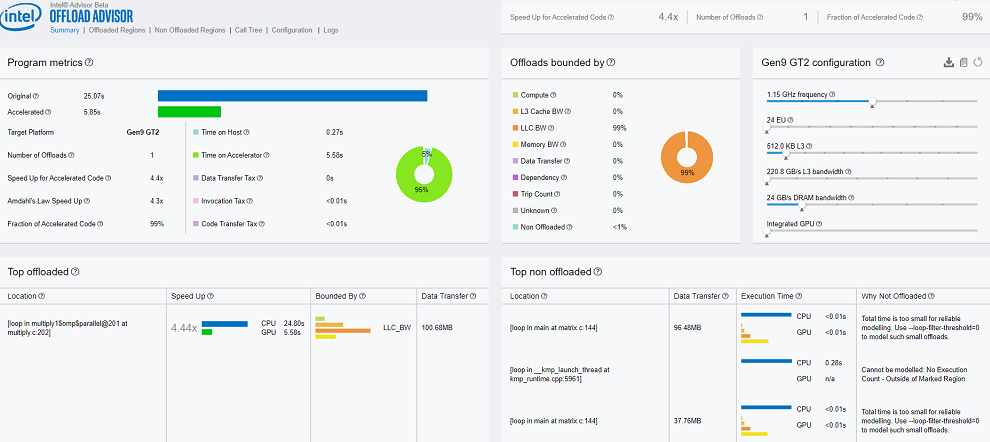
In the Summary tab of the report, review the following:
In the Program Metrics pane: Intel Advisor predicts a 4.4x speedup if you offload the application to a GPU with the gen9_gt2 configuration. The estimated execution time is 5.85 seconds compared to the original 25.07 seconds.
In the Offload Bounded by pane: The offloads are 99% bounded by the last-level cache (LLC) bandwidth.
In the Top Offloaded pane: Intel Advisor recommends to offload the loop at multiply.c:202. Click the loop location to go to Offloaded Regions tab and see more details.
In the Top Non-Offloaded: The time spent in other loops is too small to be modeled accurately and one of loops is outside of the code region marked for offloading. For this reason, they are not recommended for offloading.
Use this information to rewrite the matrix multiply application in SYCL.
Rewrite the Matrix Multiply Code in SYCL
The Intel Advisor recommends to offload the multiply.c:202 code region of the matrix multiply application to the GPU. To do this, you need to rewrite the matrix multiply code in SYCL as follows:
Select a device.
Declare a device queue.
Declare buffers to hold the matrix.
Submit a job to the device queue.
Execute the matrix multiply in parallel.
Save the file and rebuild the application.
Run GPU Roofline
To estimate performance of the GPU version of the matrix multiply application, you can use the new GPU Roofline Insights feature. Intel Advisor can generate a Roofline model for kernels running on an Intel® GPU. The Roofline model is a very efficient way to characterize your kernels and visualize how far you are from ideal performance.
Prerequisites: Before running the GPU Roofline Insights, make sure your system is properly configured to analyze GPU kernels.
Add your username to the video group. To check if you are already in the video group, run:
If you are not part of the video group, add your username to it:
Enable GPU metrics collection:
Make sure that your SYCL code runs correctly on the GPU. To check which hardware you are running on, add the following to your SYCL code and run it:
Set up the Intel Advisor environment variables:
To run the GPU Roofline Insights from the Intel Advisor CLI:
Run the Survey analysis with the --profile-gpu option:
Run the Trip Count and FLOP analysis with --profile-gpu:
Generate an HTML report with a GPU Roofline chart:
Open the generated roofline.html in a web browser.

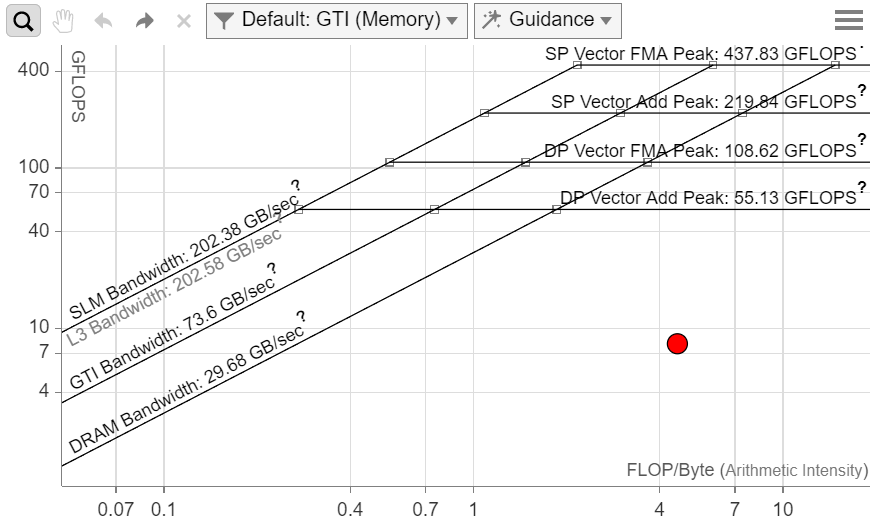
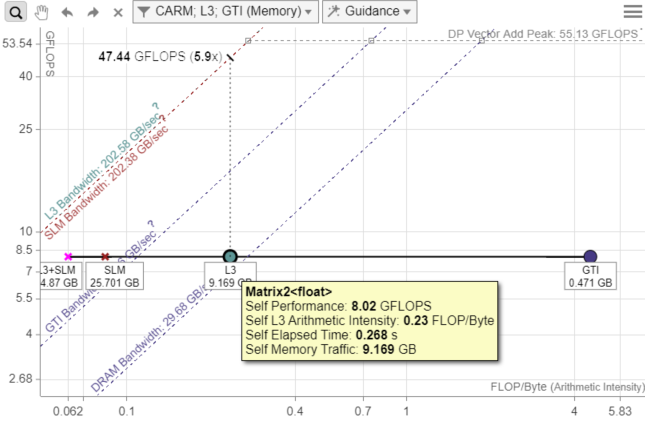
To get more information on different parts of memory, you can choose to display different dots based on which memory subsystem is used for the arithmetic intensity calculation. In this case, choose GTI (Memory) and L3 + SLM memory levels.

Double-click a dot to see more information about it:
The L3 dot is very close to the L3 maximum bandwidth. To get more FLOPS, you need to optimize caches further. A cache-blocking optimization strategy can make better use of memory and should increase the performance.
The GTI dot, which represents traffic between the GPU, GPU uncore (LLC), and main memory, is far from the GTI roofline. Transfer costs between CPU and GPU do not seem to be an issue.

Next Steps
Refactor the SYCL code to optimize memory usage. You can use the cache-blocking technique to significantly improve performance.
Key Take-Aways
Use the Offload Modeling feature of the Intel Advisor to find the best candidates for code to offload to the GPU, estimate the outcome of porting to GPU, and identify performance bottlenecks.
Use GPU Roofline Insights feature of the Intel Advisor to identify bottlenecks in code already ported to GPU and see how close its performance is to the system maximums.