Use GPU Roofline to Identify Optimization Opportunities
This recipe focuses on a step-by-step approach to optimize a SYCL application running on the Intel® GPU platform using Intel® Advisor.
This recipe describes how to analyze the application performance using the Intel Advisor GPU Roofline. With Intel Advisor built-in recommendations, you can improve the application performance by 1.63 x compared to the baseline result, making iterative changes to the source code. The sections below describe all the optimization steps in detail.
Ingredients
This section lists the hardware and software used to produce the specific result shown in this recipe:
- Performance analysis tool:Intel Advisor
Available for download at https://www.intel.com/content/www/us/en/developer/tools/oneapi/advisor.html
- Application:
QuickSilver sample application
Available for download from GitHub* at https://github.com/oneapi-src/Velocity-Bench/tree/main/QuickSilver/SYCL/src
- Workload:
- scatteringOnly.inp
- Coral2_p1_1*.inp
Available at https://github.com/oneapi-src/Velocity-Bench/tree/main/QuickSilver/Examples
- Compiler: Intel® oneAPI DPC++/C++ Compiler
Available for download at standalone components catalog
- Operating system: Linux* OS (Ubuntu 22.04.3 LTS)
- CPU:Intel® Xeon® Platinum 8480+ processor (code named Sapphire Rapids)
- GPU:Intel® Data Center GPU max 1550 (code named Ponte Vecchio)
Prerequisites
- Set up the environment variables for Intel® oneAPI DPC++/C++ Compiler and Intel® Advisor, for example:
- Verify that you set up both tools correctly – for that, run:
If all is set up correctly, you should see a version of each tool.
Build the Application
- Clone the application's GitHub repository to your local system:
- Traverse to the QuickSilver application repo:
- Create a build directory:
- From the build directory, run the following commands to build the QuickSilver application using cmake: You should see the qs executable in the current directory.
- If you want to run the demo of the performance metric for the QuickSilver application, use this command: On the console output, look for Figure Of Merit which is the performance metric for this application (higher the better).
Establish a Baseline
- Run the GPU Roofline Insights perspective on the built qs binary using the following commands:
- Open the result in the Intel Advisor GUI.
- In the Summary reporte, examine GPU time, GPU hotspots and other data.
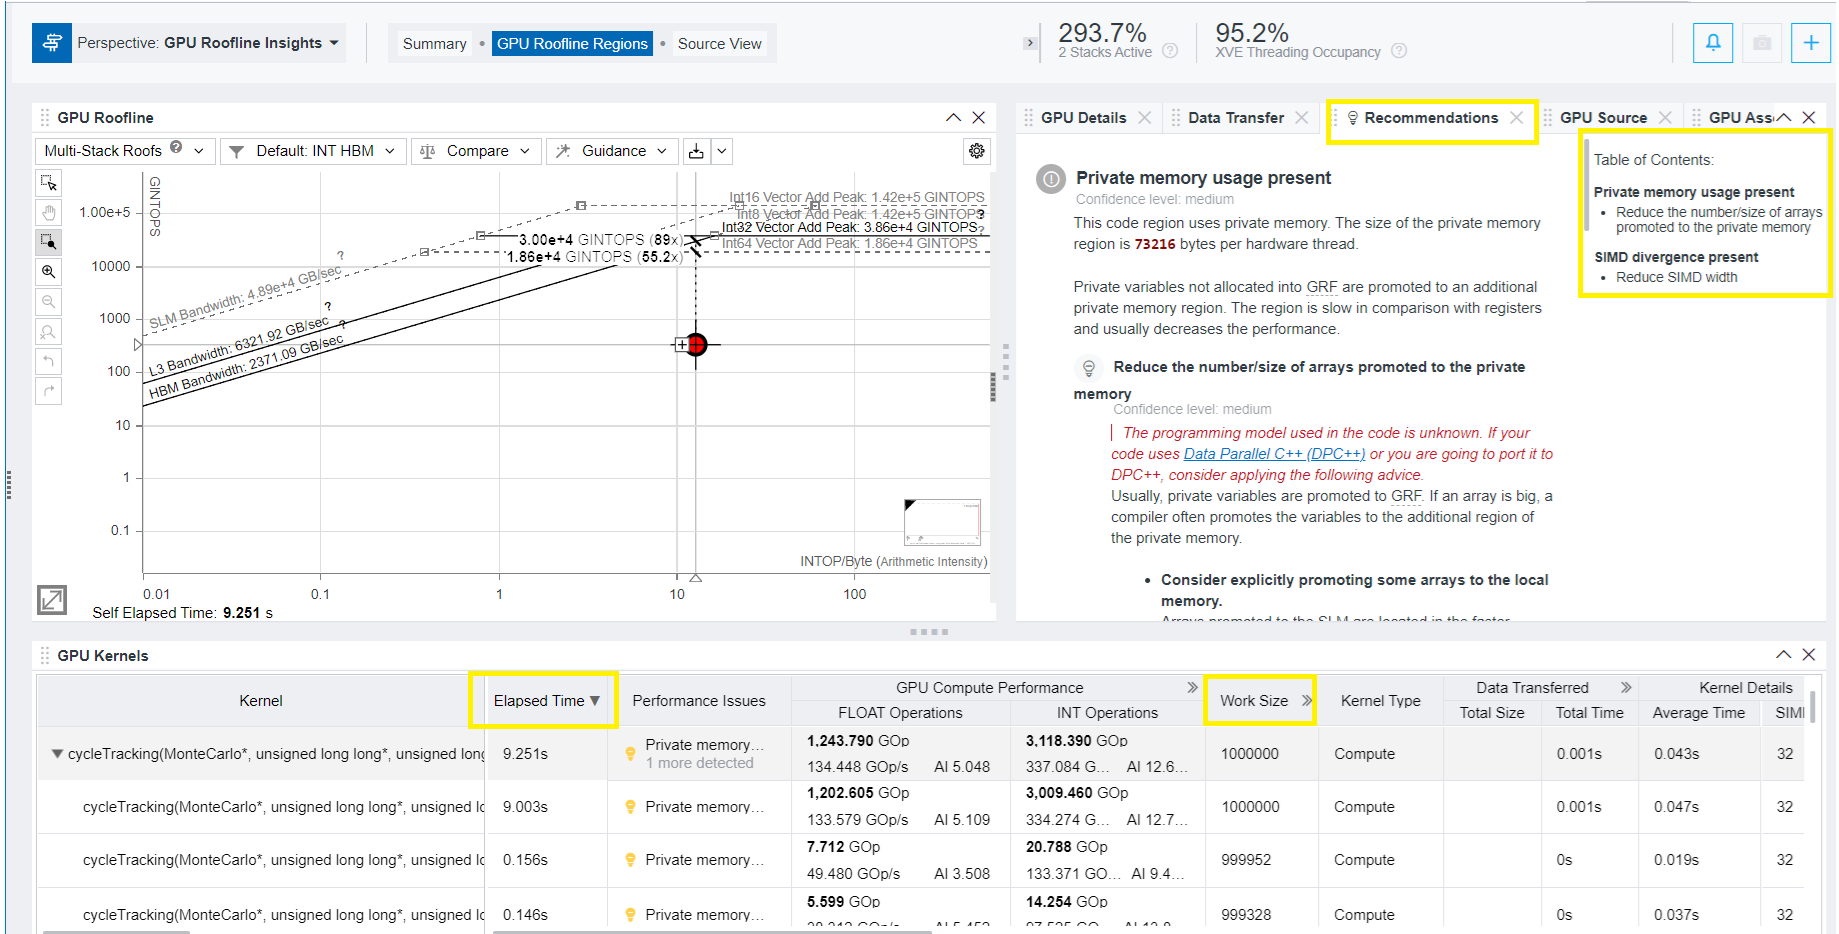
- Move to GPU Roofline Regions pane and examine the GPU roofline for the kernels running on GPU. Review the elapsed time for each kernel call, OPS, local & global work size used by kernel, memory usage data (L3, SLM), and other informationa. For the detected performance issue, explore the Recommendations tab that provides built-in knowledge on how it can be addressed.
In the example below, the Recommendations tab contains two suggestions for the GPU kernels running on Intel® Data Center GPU Max 1550. They refer to:
- Private memory usage present.
- SIMD divergence present.
Apply Recommendations
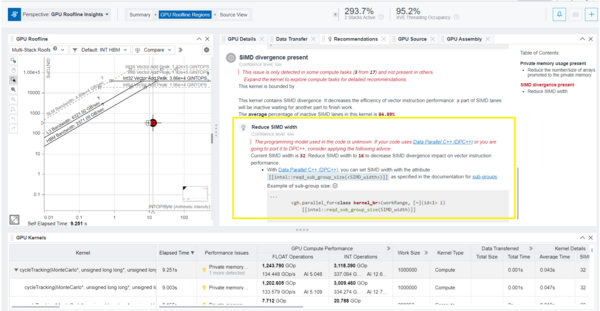
- To investigate the issue and discover the optimization technique to overcome it, select the recommendation from the Table of Contents on the right and examine its details. The figure below shows that there is a SIMD divergence in the kernel, which decreases the efficiency of vector instruction performance. To address the issue, Intel Advisor recommends you to reduce the SIMD width.
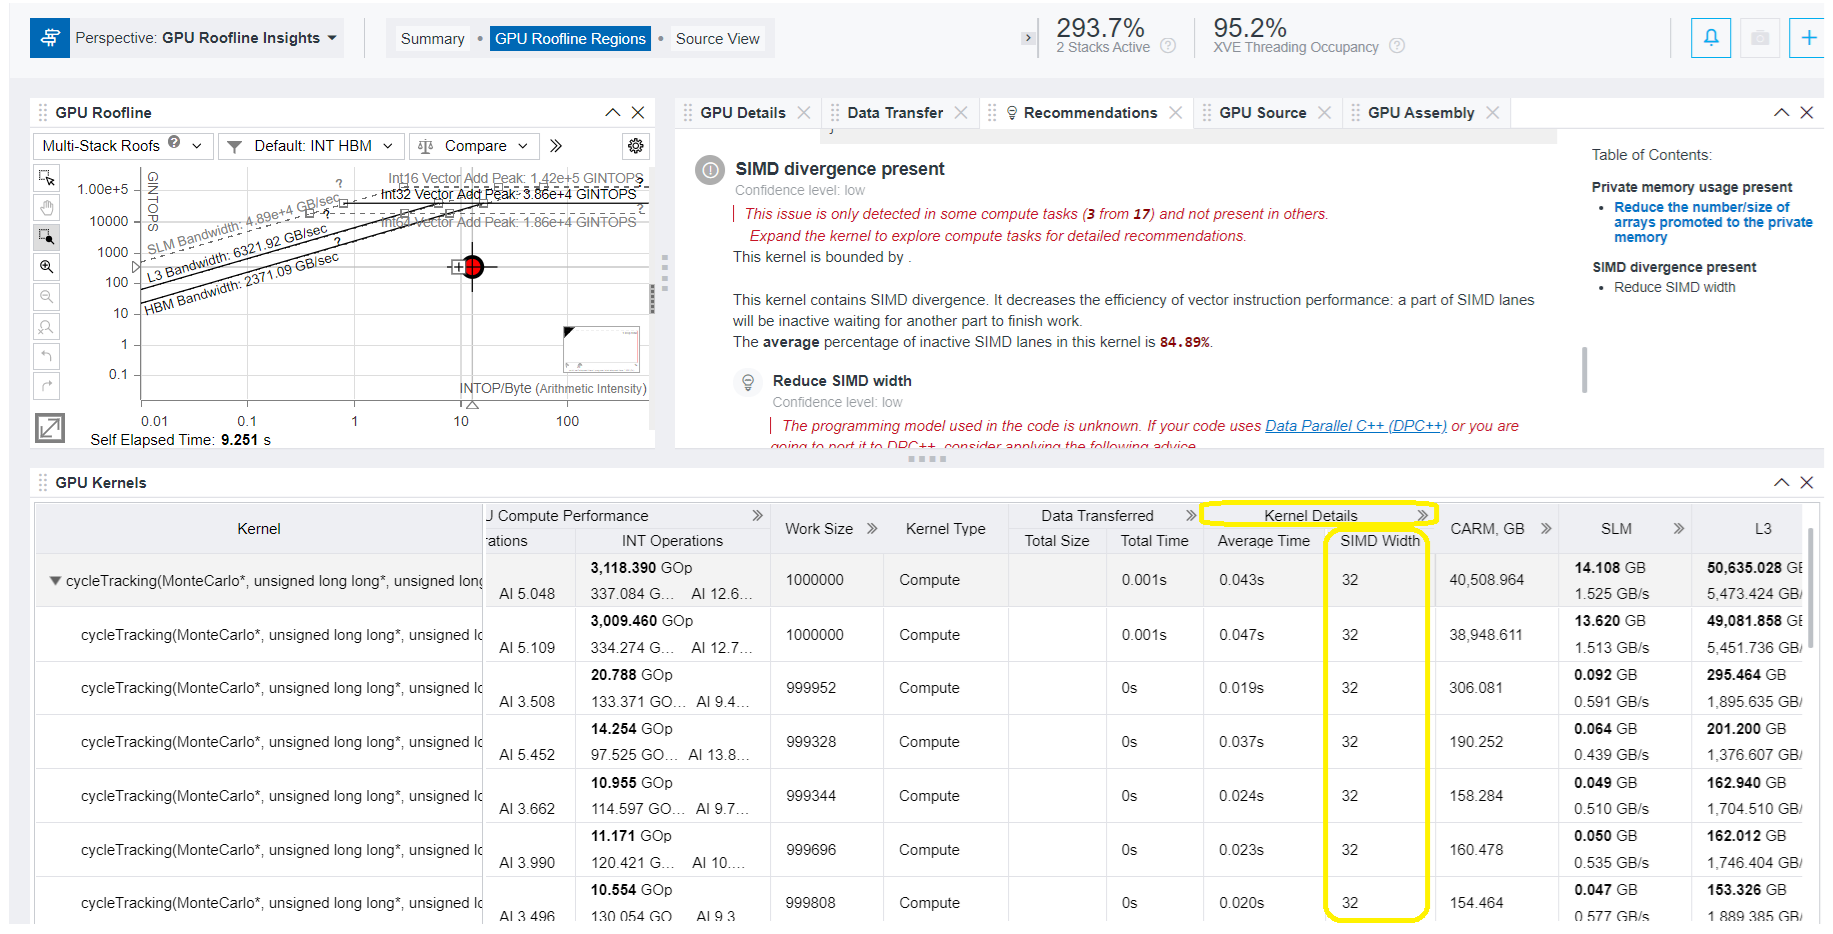
- To discover the SIMD width currently used by the kernel, examine the value under Kernel Details. In this example it is 32.
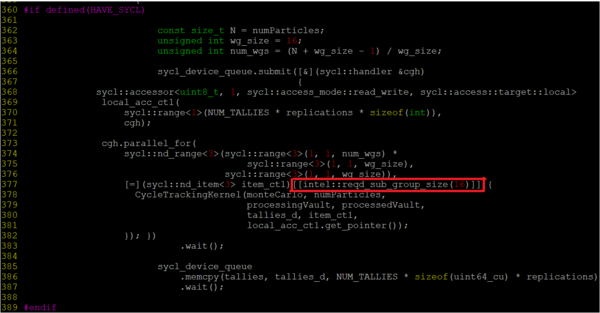
- To implement the recommendation and reduce the SIMD width, add the following to the kernel call: Locate the main.cc.dpc.cpp file from QuickSilver source application and make the necessary changes as follows:
The example in figure below shows how to change main.cc.dp.cpp to set SIMD width to 16.
- Rebuild the binary after update:
- To renew the GPU Roofline Insights perspective using the latest binary, run the following command:
- Examine the result in the Intel Advisor GUI.
Verify the Change and Analyze Performance Impact
- In the GPU Roofline Regions tab of the GPU Roofline Insights perspective, review the Elapsed Time, SIMD Width, Register Spilling metrics for the GPU kernel.
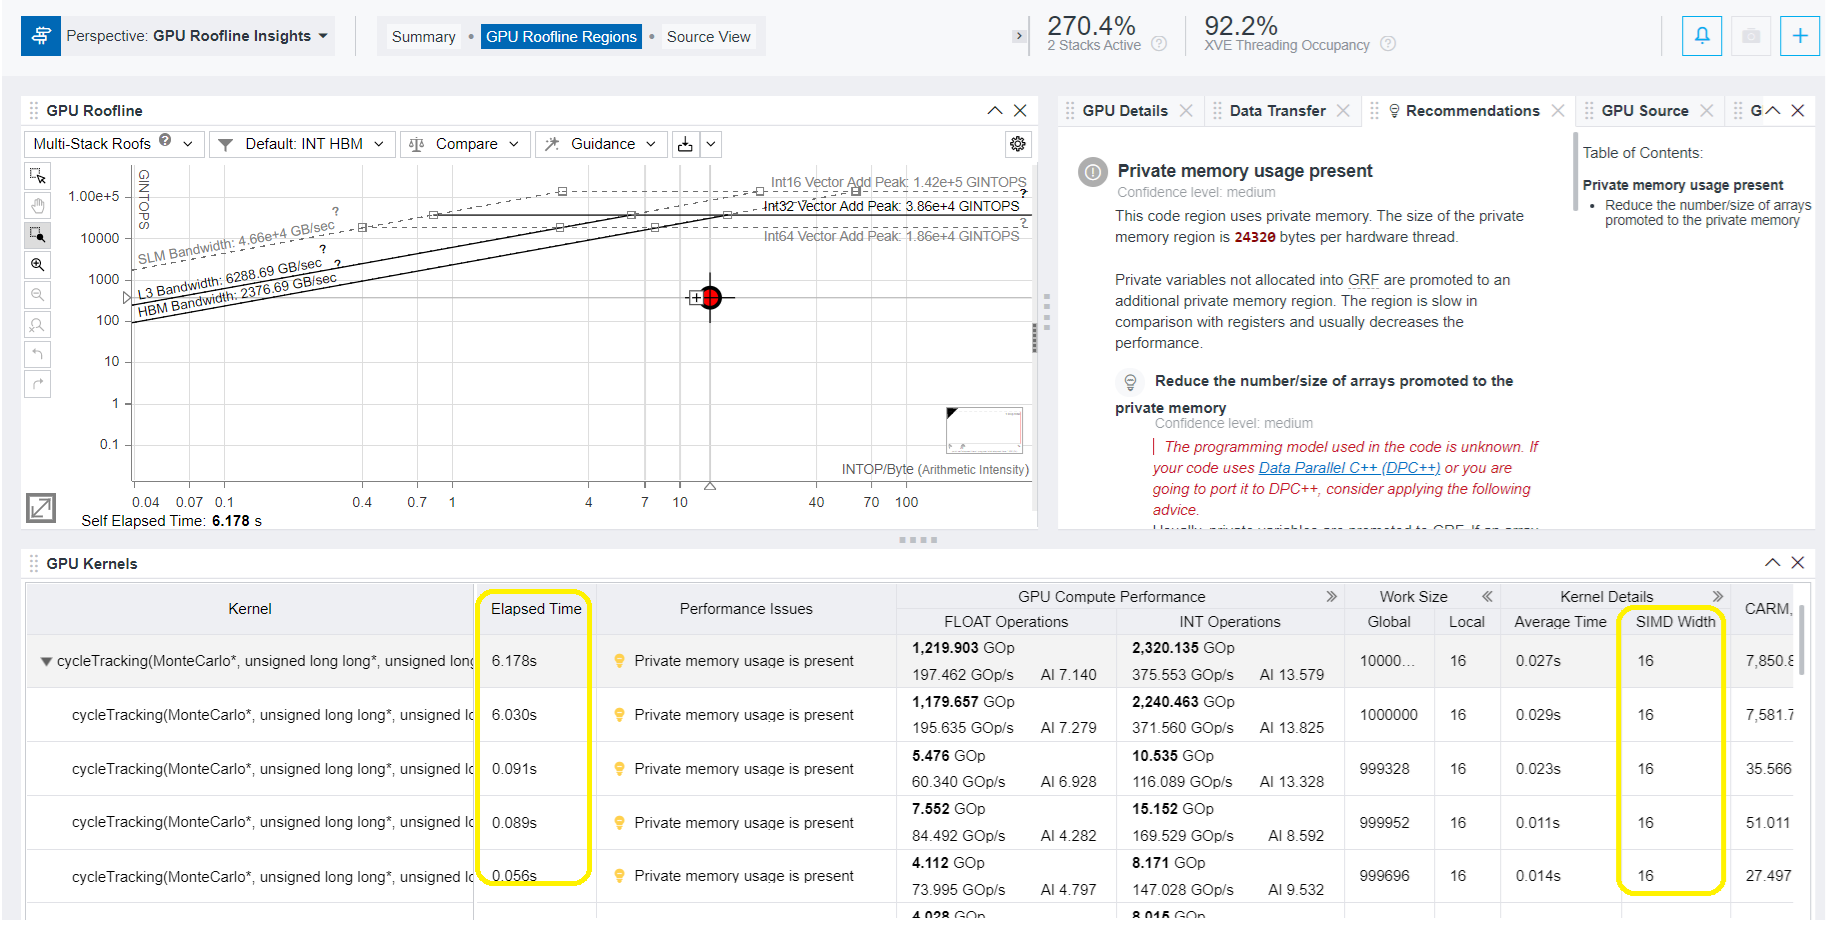
- Under Kernel Details, make sure the SIMD Width value is now 16. Respectively, the Elapsed Time has been reduced from 9.003 seconds to 6.030 seconds for the first kernel call in this example.
Avoid Register Spill
The GPU Roofline Regions tab also include the Register Spilling metric. Register spilling can cause significant performance degradation, especially when spills occur inside hot loops. When variables are not promoted to registers, accesses to these variables incur significant increase of memory traffic. In this example, this metric has value of 1408 B.
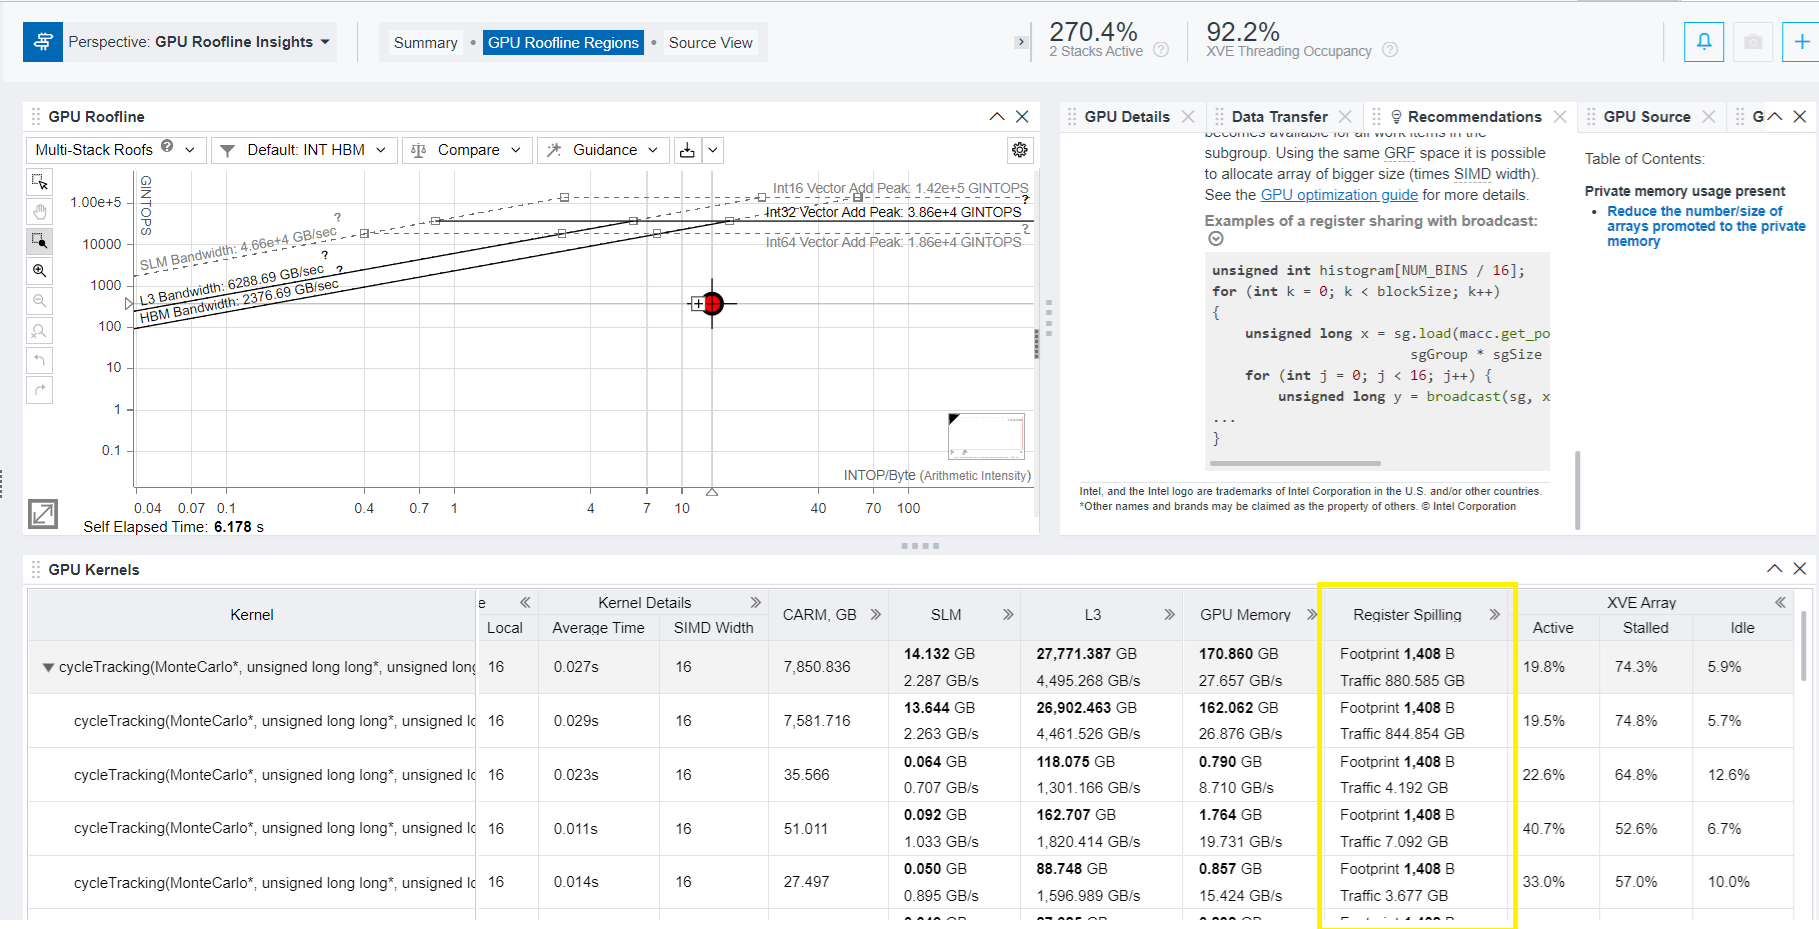
By default, small register mode (128 GRF) is used. To avoid register spill, it is recommended to use large register mode (256 GRF). For that, do the following:
- Add this command to the CMake file:

- Rebuild the binary:
- To renew the GPU Roofline Insights perspective using the latest binary, run the following command:
- Examine the result in the Intel Advisor GUI.
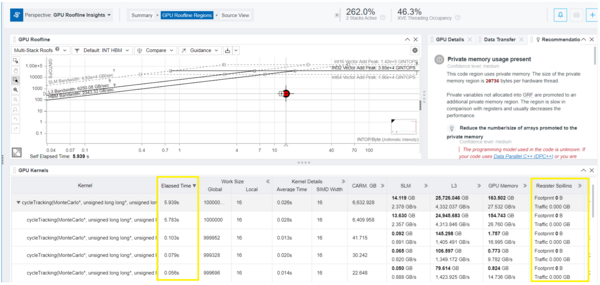
- In the GPU Roofline Regions tab of the GPU Roofline Insights, review the Elapsed Time and Register Spilling metrics for the GPU kernel after applying the large GRF mode. Make sure the Register Spilling value is now 0 B, and the Elapsed Time has further reduced - in this example from 6.030 to 5.763 seconds.
Next Steps
The current work group size seen from the roofline perspective is now 16. You can experiment with increasing this value to 32 or 64, and observe the performance implications.
The GPU Roofline Regions tab has one more recommendation on the private memory usage presence You can try to use local memory instead of global memory for variables.