Analyze Performance Remotely and Visualize Results on a Local macOS* System
If you must run your application on a dedicated remote system like clusters with strict time schedules and limited capabilities for visualization and data manipulation, you can analyze the application with the Intel® Advisor CLI and benefit from using the Intel® Advisor GUI for results investigation. This recipe shows how to collect performance data on a remote system using the Intel Advisor command line interface and view the results on a local macOS* system using the Intel Advisor GUI.
Collect performance data on a remote system using the Intel Advisor CLI.
View the results on a local macOS with the Intel Advisor GUI.
Scenario
It is a common use case for a high performance, parallel and vectorized code to be run on dedicated remote systems like clusters with strict time schedules and limited capabilities for visualization and data manipulation. Tools for performance assessment are often limited to running from the command line, and many conveniences like GUI interfaces and access to online documentation resources are often unavailable on these types of systems.
On macOS* systems, the Intel® Advisor capabilities are limited and it does not support data collection; you can only view data collected on a Windows* OS or Linux* OS.
Ingredients
This section lists the hardware and software used to produce the specific result shown in this recipe:
Performance analysis tools: Intel® Advisor
The latest version is available for download at https://www.intel.com/content/www/us/en/developer/tools/oneapi/advisor.html.
Application: Standard Vectorization sample code, available as a part of the sample package in the Intel Advisor installation folder:
On Windows OS: <install_dir>\samples\en\C++\vec_sample.zip
On Linux OS: <install_dir>/samples/en/C++/vec_sample.tgz
Compiler: Intel® C++ Compiler
The latest version is available for download at https://www.intel.com/content/www/us/en/developer/tools/oneapi/dpc-compiler.html.
Target operating system: Microsoft Windows* 10 Enterprise
CPU: Intel® Core™ I5-6300U processor
Prerequisites
Make sure you build your application for analysis with debug information enabled and inline debug information included. For more information, see Build Target Application in Intel® Advisor User Guide.
Recommendation: The application for analysis, along with its binaries, symbol information, and source code, should be located on a shared drive visible to both local and remote machines.
Collect Performance Data on a Remote System
On the remote system, you can collect any performance data for your application. This recipe describes how to collect Roofline, Memory Access Patterns, and Dependencies data using the Intel Advisor CLI.
Get Command Lines for Your Application from GUI
You can use the Intel Advisor GUI on your local machine to get command lines for running an analysis on your application that you can copy and run on the remote system.
Open the Intel Advisor GUI on the local machine.
Set up the project properties.
Click the Get Command Line
 button on the Workflow tab under the desired analysis.
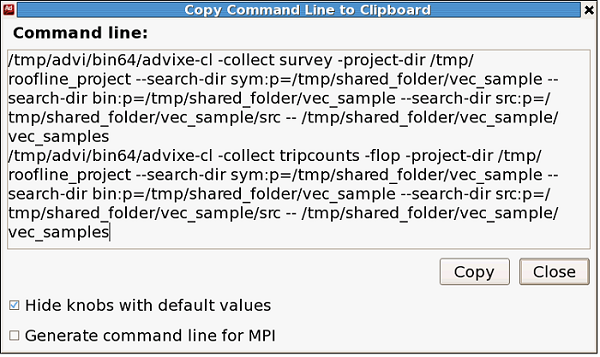
 From the opened dialog window, copy the generated command lines for launching this type of analysis with the current settings.
For example, for the Roofline analysis, the Intel Advisor generates two commands for Survey and Trip Counts and FLOP analyses, which include parameters with search paths to binary, symbol, and source files as set in the project properties:

- Optional: if your application, its binaries, symbol information, and source code are not located on a shared drive, replace the local paths with the correct paths on the remote system.
Switch to your remote system and run the command lines copied.
For more information about the Copy Command Line to Clipboard, see the Generate Command Lines from GUI in the Intel Advisor User Guide.
If you want to view the results on a local macOS* system, it is not recommended to use --no-auto-finalize option for reducing collection and finalization time. We suggest doing all the finalization on the target (remote) system along with the analysis. As a macOS* system might not have the same version of compiler, runtimes, math libraries, and other parts of analyzed application stack, finalization on the target system should better capture all these details.
Run the Roofline Analysis
While on the remote system:
Run the Roofline analysis from a command prompt. For example, you can use the shortcut --collect=roofline command:
Optional: If you only need the Roofline report, you can export it as an HTML file with the following command:
After this, you can proceed to View the Results on a Local macOS with the Intel Advisor GUI.
For more information about the Roofline analysis, see the Roofline Analysis topic in the Intel Advisor User Guide.
Run the Memory Access Patterns and Dependencies Analyses
After getting Survey and/or Roofline analysis results, you may want to perform deeper analysis for certain loops to detect inefficient memory access patterns or determine whether they have data dependencies between iterations.
While on the remote system:
Mark up loops for analysis using the --mark-up-loops action. This command accepts a comma-separated list of source locations in a filename:linenumber format. To mark line 34 in the foo.cpp file and line 192 in the bar.cpp file:
NOTE:These loops will remain selected for future Trip Counts, Memory Access Patterns, and Dependencies analyses unless otherwise specified.Collect Memory Access Patterns data for the loops marked up:
Run the Dependencies analysis for the marked-up loops:
You can also mark up loops for one analysis only using the --mark-up-list option during collection. This option takes a comma-separated list of loop ID or source locations. To get the IDs or source locations, use the Survey report generated with the CLI or select loops with checkboxes on the Survey report tab the GUI and get the corresponding command line on the Workflow pane.
After you identify loops for analysis, run the analysis of choice with the --mark-up-list option. For example, run the Memory Access Patterns analysis with loop IDs specified:
View Results on a Local macOS* System
To view the results on a local system, you need to copy them from your remote system. Do one of the following:
- Option 1. If you do not have a shared drive visible to both local and remote systems:
On the remote system, pack your analysis results into a snapshot with the my_proj_snapshot name:
Copy my_proj_snapshot.advixeexpz to the local macOS host.
Switch to the local macOS system.
Open the snapshot in the Intel Advisor GUI to view the results:
From the command prompt:
From the GUI: Launch the Intel Advisor, go to File > Open > Result, and navigate to the copied snapshot.
- View the results.
Option 2. If you have a shared drive visible to both local and remote systems:
Copy the vec_project directory to a shared drive.
Open the project in the Intel Advisor GUI:
From the command prompt:
From the GUI: Launch the Intel Advisor, go to File > Open > Project, and navigate to the copied snapshot.
Go to the File > Project properties and set up the binary, symbol, and source paths for the analyzed application in the shared location in the Binary/Symbol Search and Source Search tabs.
View the results.
Option 3 (for Roofline only). If you only need a Roofline report and you have it exported as an HTML file:
Copy the HTML report to a shared drive or to the local macOS system.
Switch to the local system.
Open the report in a browser and view the results.
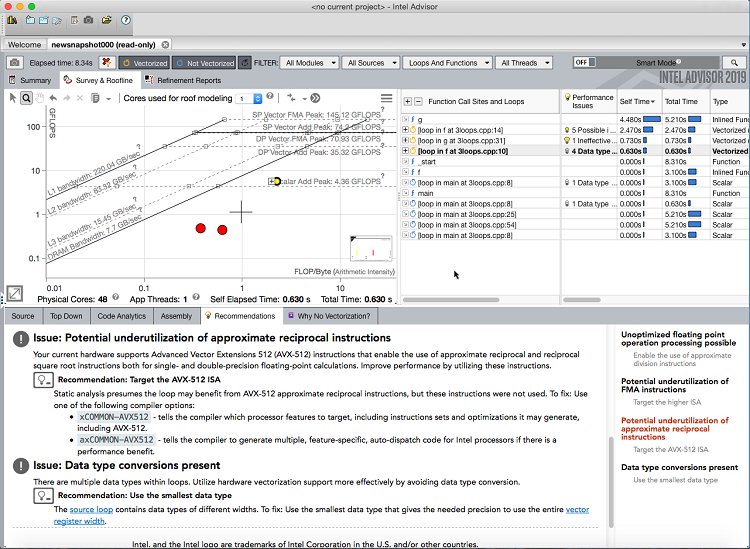
Once you open the results, the full content of the GUI should be available on your macOS system. You can view the results of Intel Advisor analyses, identify the vectorization inefficiencies and optimization opportunities, and study the Roofline chart. All these performance observations are mapped to source code and assembly.

Key Take-Aways
You can have full Intel Advisor GUI experience on a local macOS or Windows system without the need to set up the GUI on a remote Linux cluster node.
You cannot run a new analysis on a macOS system, but you can visualize your results generated on a remote system like cluster system with the Intel Advisor CLI.
See Also
This section also lists links to all documents and resources the recipe refers to:
User Guide: Generate Command Lines from GUI
User Guide: Roofline Analysis