Optimize Memory Access Patterns using Loop Interchange and Cache Blocking Techniques
Understanding how your application accesses data, and how that data fits in the cache, is a critical part of optimizing the performance of your code. In this recipe, use the Memory Access Patterns analysis and recommendations to identify and address common memory bottlenecks, using techniques like loop interchange and cache blocking.
Scenario
Some of the most common problems in today's computer science domain - such as artificial intelligence, simulation, and modeling - involve matrix multiplication. The algorithm in this recipe is a triply-nested loop with a multiply and an add operation for each iteration. It is computationally intensive and accesses a lot of memory.
Ingredients
This section lists the hardware and software used to produce the specific results shown in this recipe:
Performance analysis tools: Intel Advisor
Available for download at https://www.intel.com/content/www/us/en/developer/articles/tool/oneapi-standalone-components.html#advisor.
Application: Standard C++ matrix multiply, as described in Scenario
Not available for download.
Compiler: Intel® C++ Compiler Classic
Available for download as a standalone and as part of Intel® HPC Toolkit.
Operating system: Microsoft Windows* 10 Enterprise
CPU: Intel® Core™ I5-6300U processor
Establish a Baseline
Run the CPU / Memory Roofline Insights perspective in the Intel Advisor CLI:
The matrix multiply application runs and completes in 151.36 seconds.
Open the Roofline chart in the Intel Advisor GUI to visualize performance.
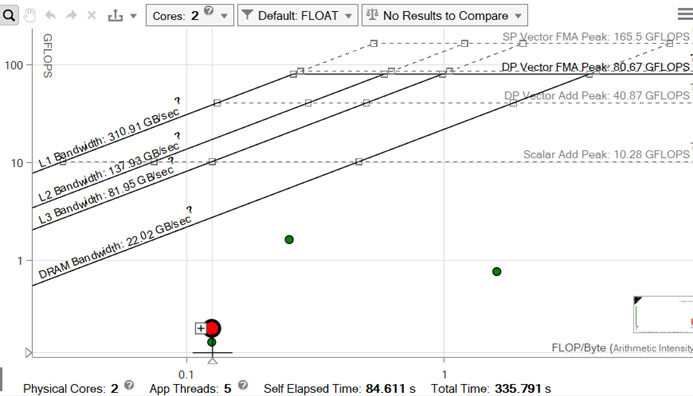
The red dot is the main computational loop. Notice it is far below the DRAM bandwidth maximum, indicated by the lowest diagonal line. This tells us the loop has potential problems with memory accesses.
Open the Survey report in the Intel Advisor GUI to identify potential problems and recommendations.
Notice Inefficient memory access patterns present in Performance Issues and 49% in Efficiency:


To investigate possible memory bandwidth issues:
Run a Memory Access Patterns analysis in the Intel Advisor CLI:
Open the Memory Access Patterns report in the Intel Advisor GUI to analyze how the data structure layout affects performance.
Unit stride is preferred for vectorization; however, the Intel Advisor detects 50% constant strides and 50% unit strides for this loop. Equally important, the Intel Advisor detects a constant stride of 2048 on the read access and a uniform stride of 0 on the write access, while the range of memory accessed is 6 MB.


Perform a Loop Interchange
The constant stride of 2048 is a result of the access of b[k][j], where k is the index variable:
Interchanging the two inner loops will convert the constant stride to unit stride and eliminate the need to access memory over such a wide range.
Edit the matrix multiply application by interchanging the two inner loops:
Run another CPU / Memory Roofline Insights perspective in the CLI:
The matrix multiply application runs and completes in 5.53 seconds.
Open the Roofline chart in the GUI to visualize performance.
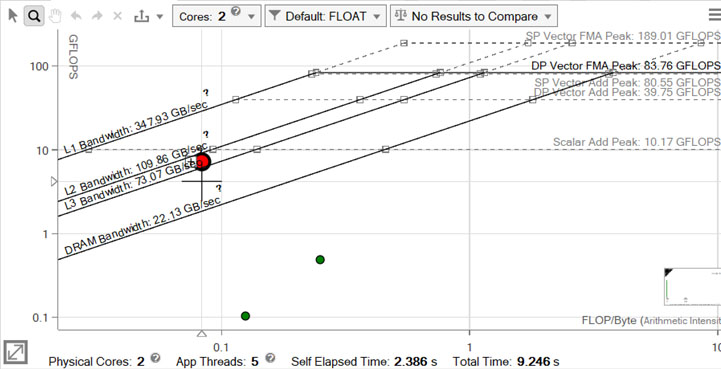
The loop, represented by the red dot, is now just below the L2 peak bandwidth:
Examine Memory Traffic at Each Level of the Memory Hierarchy
Re-run CPU / Memory Roofline Insights perspective in the CLI with the cache simulation feature enabled:
Open the Roofline chart in the GUI to visualize performance.
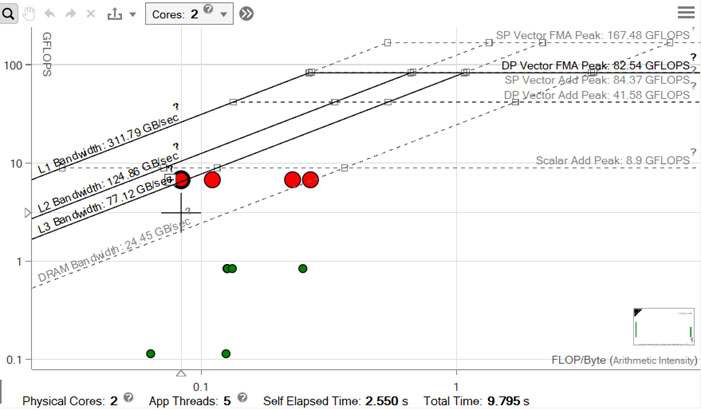
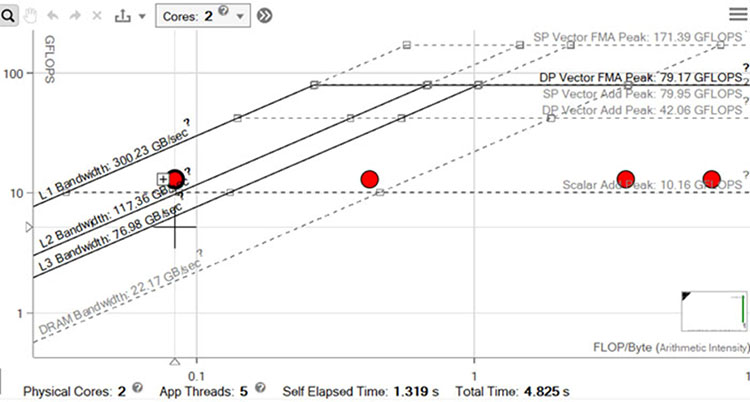
Each red dot represents the loop at each level of the memory hierarchy. Given the far left dot is only at the L3 bandwidth roof, it is clear the loop is not hitting L1 cache efficiently. The far right dot represents DRAM and it appears to be at the DRAM bandwidth roof. So our next optimization goal: Do a better job fitting our data into L1 cache.
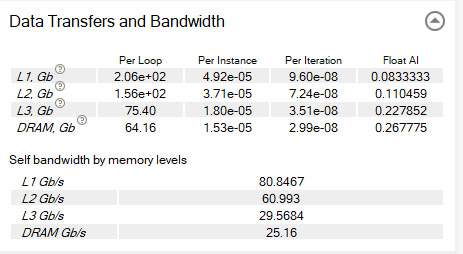
Check the Code Analytics tab below the Roofline chart to examine memory traffic:
Open the Survey report in the GUI to examine vector efficiency.
Notice the loop is now vectorized at 96% efficiency using AVX2:

To verify the new access patterns:
Re-run Memory Access Patterns analysis in the CLI:
Open the Memory Access Patterns report in the GUI.
Intel Advisor shows all accesses are now unit stride:

Implement a Cache-Blocking Strategy
The matrix multiply application is now fairly well optimized. Another possible improvement that works well when processing a large amount of data: Break up the application into smaller partitions to perform computations over a smaller range of memory. This technique is called cache blocking, and will enable the loop to fit within L1 cache.
Edit the matrix multiply application to add:
Pragmas to tell the compliler:
Memory is aligned.
Do not unroll.
Three additional nested loops so computations are performed serially in sections (or blocks)
Re-run CPU / Memory Roofline Insights perspective in the CLI:
The matrix multiply application runs and completes in 3.29 seconds.
Open the integrated Roofline chart in the GUI to visualize performance.
The far left dot is closer to the L1 bandwidth roof, so we are doing a better job fitting our data into L1 cache. Interestingly enough, the far right dot representing DRAM is now far below the DRAM bandwidth roof. This is because there is less DRAM traffic and more L1-L3 traffic, thus higher Arithmetic Intensity and FLOPs. This is our objective.
Result Summary
Run |
Time Elapsed |
Time Improvement |
|---|---|---|
Baseline |
151.36 seconds |
N/A |
Loop Interchange |
5.53 |
27.37x |
Cache Block |
3.29 |
1.68x |
Key Take-Aways
You can dramatically increase performance by optimizing memory.
Understanding the following is critical to meet performance optimization objectives:
How an application accesses data structures
How those data structures fit in cache