Analyze Vectorization and Memory Aspects of an MPI Application
Since a distributed HPC application runs on a collection of several discrete nodes, apart from optimizing MPI communications across nodes and within nodes, you must also account for optimizations like vectorization on a per-node basis. This recipe explains how to use the vectorization and memory-specific capabilities and recommendations of the Intel® Advisor features to analyze an MPI application.
To analyze an MPI application with the Intel Advisor, do the following:
[Optional] Run the Dependencies analysis.
[Optional] Run the Memory Access Patterns analysis.
Scenario
You can collect data for MPI applications only with the Intel Advisor CLI, but you can view the results with the standalone GUI, as well as the command line. You can also use the GUI to generate required command lines. For more information about this feature, see Generate Command Lines from GUI in the Intel® Advisor User Guide.
This recipe describes an example workflow of analyzing the Weather Research and Forecasting (WRF) Model*, which is a popular MPI-based numerical application for weather prediction. Depending on a type of your MPI application, you can collect data on a different number of ranks:
For profiling MPI applications written under the Single Program Multiple Data (SPMD) framework, like WRF, it is enough to collect data on a single MPI rank only, since all ranks execute the same code for a different subset of data. This also decreases the collection overhead.
You can use Application Performance Snapshot, which is part of Intel® VTune™ Profiler, to detect outlier ranks and selectively analyze them.
For Multiple Program Multiple Data (MPMD) applications, you should analyze all MPI ranks.
Ingredients
This section lists the hardware and software used to produce the specific result shown in this recipe:
Performance analysis tools: Intel Advisor
The latest version is available for download at https://www.intel.com/content/www/us/en/developer/tools/oneapi/advisor.html.
Application: Weather Research and Forecasting (WRF) Model version 3.9.1.1. The WRF workload used is Conus12km.
The application is available for download at https://www.mmm.ucar.edu/weather-research-and-forecasting-model.
IMPORTANT:You also must install the following application dependencies: zlib-1.2.11, szip-2.1.1, hdf5-1.8.21, netcdf-c-4.6.3 and netcdf-fortran-4.4.5.Compiler:
Intel® C++ Compiler
The latest version is available for download at https://www.intel.com/content/www/us/en/developer/tools/oneapi/dpc-compiler.html.
Intel® Fortran Compiler
The latest version is available for download at https://www.intel.com/content/www/us/en/developer/tools/oneapi/fortran-compiler.html.
Other tools: Intel® MPI Library
The latest version is available for download at https://www.intel.com/content/www/us/en/developer/tools/oneapi/mpi-library.html.
Operating system: CentOS* 7
Data was collected on a CentOS 7 system remotely using Intel Advisor CLI through a Windows* system connected over SSH. The collected results were moved to the Windows system and analyzed using Intel Advisor GUI.
CPU: Intel® Xeon® Platinum 8260L processor with the following configuration:
=====  Processor composition  =====
Processor name    : Intel(R) Xeon(R) Platinum 8260L
Packages(sockets) : 2
Cores             : 48
Processors(CPUs)  : 96
Cores per package : 24
Threads per core  : 2
NOTE:To view your processor configuration, source the mpivars.sh script of the Intel MPI Library and run the cpuinfo -g command.
Prerequisites
Set up the environment for the required software:
source <compilers_installdir>/bin/compilervars.sh  intel64
source <mpi_library_installdir>/intel64/bin/mpivars.sh
source <advisor_installdir>/advixe-vars.sh
To verify that you successfully set up the tools, you can run the following commands. You should get the product versions.
mpiicc -v
mpiifort -v
mpiexec -V
advixe-cl --version
Set the environment variables required for the WRF application:
export LD_LIBRARY_PATH=/path_to_IO_libs/lib:$LD_LIBRARY_PATH
ulimit -s unlimited
export WRFIO_NCD_LARGE_FILE_SUPPORT=1
export KMP_STACKSIZE=512M
export OMP_NUM_THREADS=1
Build the application in the Release mode. The -g compile-time flag is recommended so that Intel Advisor can show source names and locations.
Survey Your Target Application
The first step is to run the Survey analysis on the target application using the Intel Advisor CLI. This analysis type collects high-level details about the target application. To run the analysis:
Pass the advixe-cl with collection options as an argument to the mpiexec launcher.
Use the -gtool flag to attach analysis to the ranks specified after the name of a project directory.
To execute the WRF application with 48 ranks on a single node of the Intel® Xeon® processor and attach the Survey analysis to the rank 0 only:
mpiexec -genvall -n 48 -ppn 48 -gtool "advixe-cl --collect=survey –-project-dir=<project_dir>/project1:0" ./wrf.exeThis command will generate a result folder for the rank 0 only containing the survey data.
You can also run the analysis for a set of ranks, for example 0, 10 through 15, and 47:
mpiexec -genvall -n 48 -ppn 48 -gtool "advixe-cl --collect=survey –-project-dir=<project_dir>/project1:0,10-15,47" ./wrf.exeFor details on MPI command syntax with the Intel Advisor, see Analyze MPI Workloads.
Collect Trip Counts and FLOP Data and Review the Results
After running the Survey analysis, you can view the Survey data collected for your application or collect additional information about trip counts and FLOP. To run the Trip Counts and FLOP analysis only for the rank 0 of the WRF application, execute the following command:
mpiexec -genvall -n 48 -ppn 48 -gtool "advixe-cl --collect=tripcounts --flop -–project-dir=<project_dir>/project1:0" ./wrf.exeThis command reads the collected survey data and adds details on trip counts and FLOP to it.
You can view the collected results on a remote machine or move the results to a local machine and view them with the Intel Advisor GUI. To visualize results on the local machine, you can do the following:
Pack the result files, corresponding sources and binaries in a single snapshot file with .advixeexpz extension:
advixe-cl --snapshot --project-dir=<project_dir>/project1 --pack --cache-sources --cache-binaries -- <snapshot_name>Move this snapshot to a local machine and open it with the Intel Advisor GUI.
Note the following in the results generated:
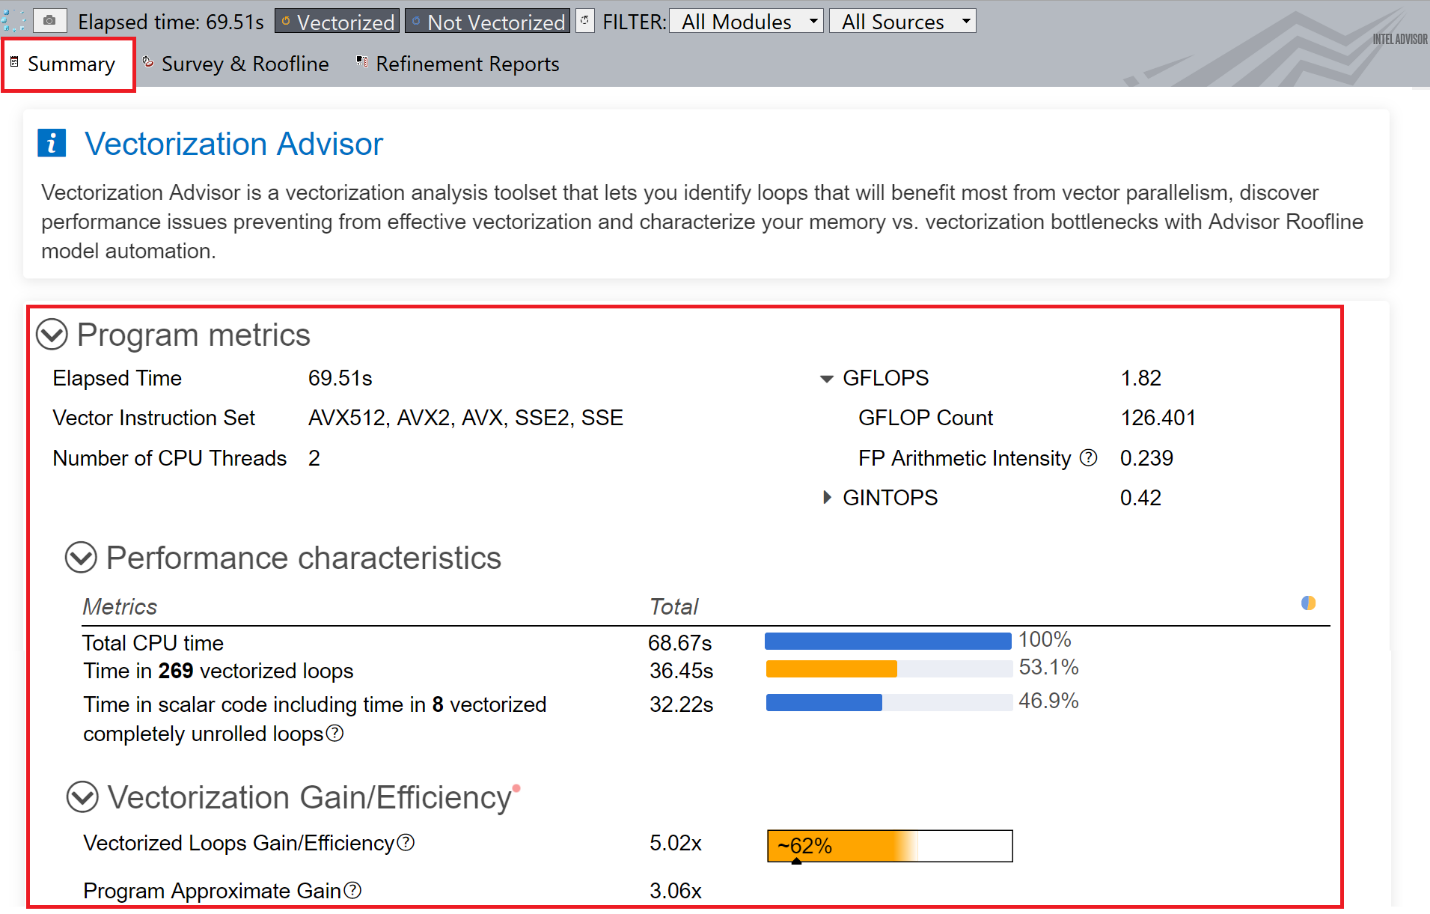
In the Summary tab of the survey report, review the program metrics like elapsed time, number of vectorized loops, vector instruction sets used, GFLOPS.
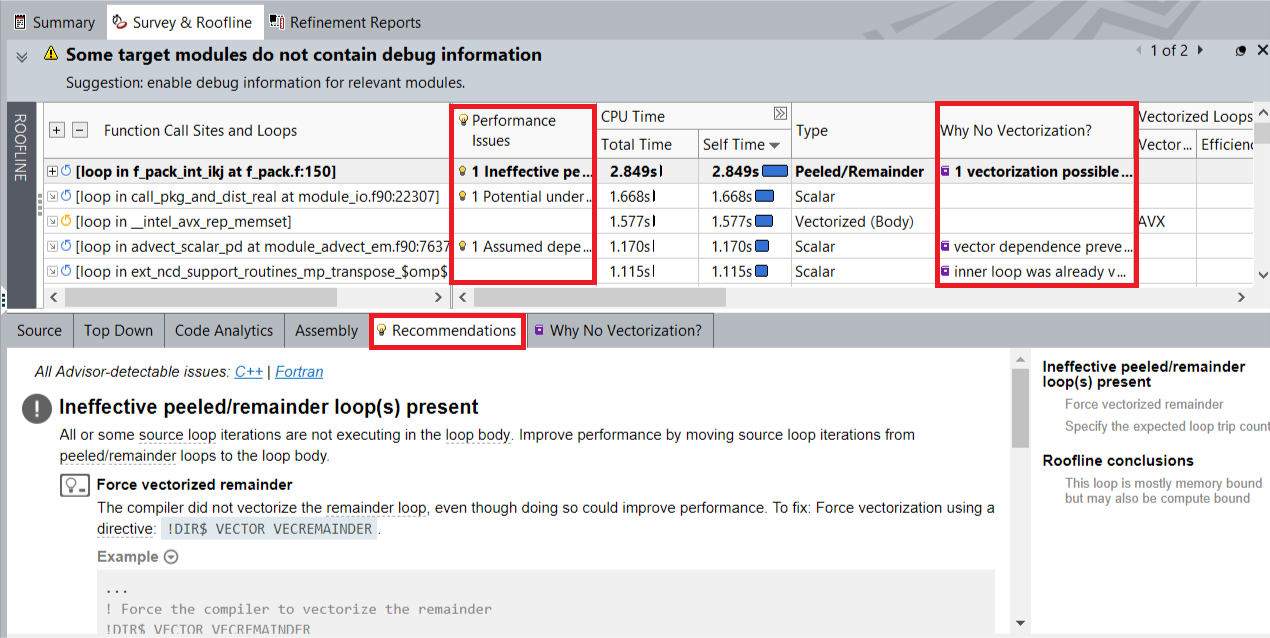
In the Survey & Roofline tab, review the details about the application performance with a list of loops/functions with the most time-consuming ones at the top. Use the messages in the Performance Issues and Why No Vectorization columns identify the next steps for improving the application performance.
Review the Roofline Chart
Intel Advisor can plot roofline charts for applications that visualize application performance levels relatively to the system's peak compute performance and memory bandwidths. To generate a roofline report for an MPI application, you must run the Survey and Trip Counts and FLOP analyses one after the other as described in the previous sections. These analyses collect all the data required to plot roofline charts for MPI applications.
To open the Roofline report, click the Roofline toggle button on the top left pane of the analysis results opened in Intel Advisor GUI. Note the following:
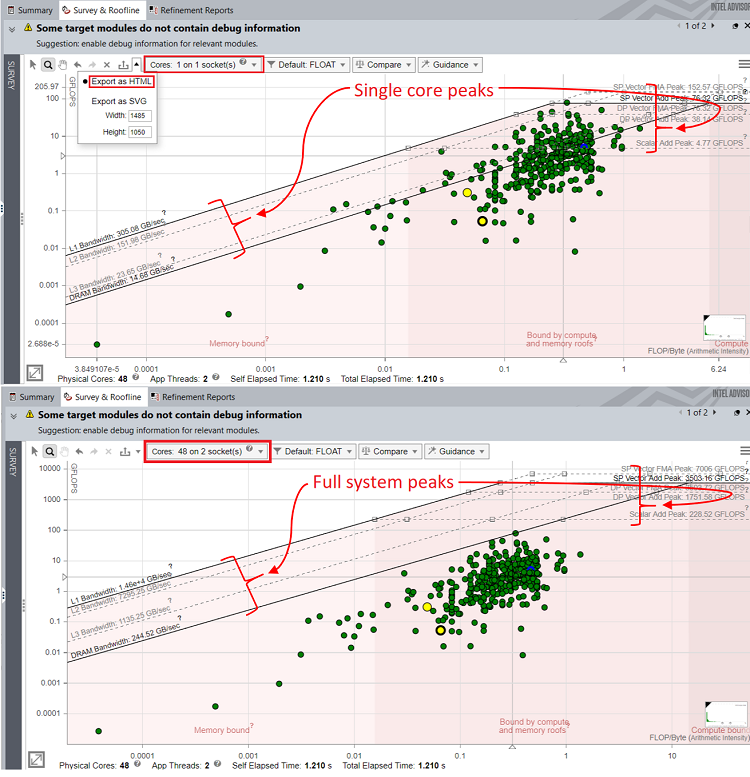
Based on dot positions along the horizontal, we can see that WRF loops are mostly bounded both by compute and memory.
Most loops take similar amount of time, which is denoted by size and color of dots.
Adjust the Roofline Chart
Since Intel® Advisor was executed on a single rank 0, the dots show performance of the rank 0 only and not the full application performance. As a result, the distance between loops and roofs (relative dots positions) in the Roofline chart shows a poorer performance than it is in reality.
To adjust the dot positions, change the number of cores from a drop-down list in the top pane of the Roofline chart to the total number of MPI ranks in the application. For the WRF application, choose 48 cores. Changing the number of cores adjusts the system memory and compute roofs accordingly in the Roofline chart. The relative positions of dots change based on the roofs plotted, but their absolute values do not change.
Export the Roofline Report (optional)
For MPI applications, the recommended way to get a separate Roofline report to share is to export it as an HTML or SVG file. Do one of the following:
In the Roofline report opened in the Intel Advisor GUI, click the Export button in the report toolbar and choose Export as HTML or Export as SVG.
Run the CLI command with the --report=roofline option. For example:
advixe-cl --report=roofline --project-dir=<project_dir>/project1 --report-output=./wrf_roofline.htmlFor MPI applications, using the CLI command is the recommended because you do not need to have an installation of Intel Advisor GUI to use it.
For more information on the Roofline, please refer to the Intel® Advisor Roofline article.
Run the Dependencies Analysis (optional)
Intel Advisor may require more details about your application performance to make useful recommendation. For example, Intel Advisor may recommend running the Dependencies analysis for some loops that have Assumed dependency present message in the Performance Issues column of the Survey report.
To collect the dependencies data, you must choose specific loops to analyze. For MPI applications, choose one of the following:
Loop IDs-based collection:
Generate a Survey report to get loop IDs:
advixe-cl --report=survey --project-dir=./<project_dir>/project1This command will create an advisor-survey.txt file with metrics for all loops in your application sorted by self time. The loop IDs are in the first column of the table:

Identify loops to run the deeper analysis on.
Run the Dependencies analysis for the selected loops on the rank 0 of the WRF application. In this case, we select loops 235 and 355:
mpiexec -genvall -n 48 -ppn 48 -gtool "advixe-cl --collect=dependencies --mark-up-list=235,355 -–project-dir=<project_dir>/project1:0" ./wrf.exe
Source location-based collection: Specify the source location of loops to analyze in the file1:line1 format and run the Dependencies analysis for the selected loops on the rank 0 of the WRF application:
mpiexec -genvall -n 48 -ppn 48 -gtool "advixe-cl --collect=dependencies --mark-up-list=module_advect_em.f90:7637,module_big_step_utilities_em.f90:2542 –-project-dir=<project_dir>/project1:0" ./wrf.exe
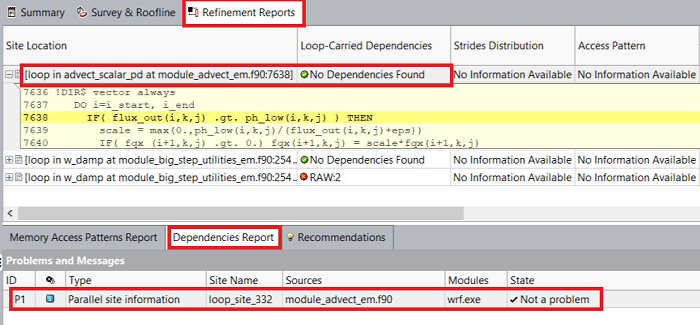
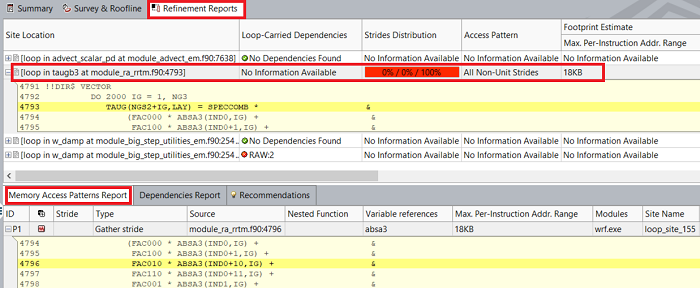
After you run the Dependencies analysis, the results will be added to the Refinement Reports tab of the analysis results. For the WRF application, the Dependencies analysis confirms that there were no dependencies in the selected loops and the Recommendations tab suggests related optimization steps.
Run the Memory Access Patterns Analysis (optional)
If you want to check your MPI application for various memory issues, such as non-contiguous memory accesses and unit stride vs. non-unit stride accesses, run the Memory Access Patterns (MAP) analysis. Intel Advisor may recommend running the MAP analysis for some loops that have Possible inefficient memory access patterns present message in the Performance Issues column of the Survey report. To run the MAP analysis:
Identify loop IDs or source locations to run the deeper analysis on.
Run the MAP analysis for the selected loops (155 and 200 in this case) on the rank 0 of the WRF application:
mpiexec -genvall -n 48 -ppn 48 -gtool "advixe-cl --collect=map --mark-up-list=155,200 --project-dir=<project_dir>/project1:0" ./wrf.exe
After you run the MAP analysis, the results will be added to the Refinement Reports tab of the analysis results. For the WRF application, the MAP analysis reported that all strides for the selected loops are random in nature, which could cause suboptimal memory and vectorization performance. See the messages in the Recommendations tab for potential next steps.
Key Take-Aways
You can use the Intel® Advisor to analyze your MPI applications on one, several, or all ranks. This recipe used the WRF Conus12 km workload.
To run the Survey, Trip Counts and FLOP, Roofline, Dependencies, or Memory Access Pattern analysis on an MPI application, you can use only Intel Advisor CLI commands, but you can visualize the results generated in the Intel Advisor GUI.
See Also
This section lists links to all documents and resources the recipe refers to: