See the Performance Gain
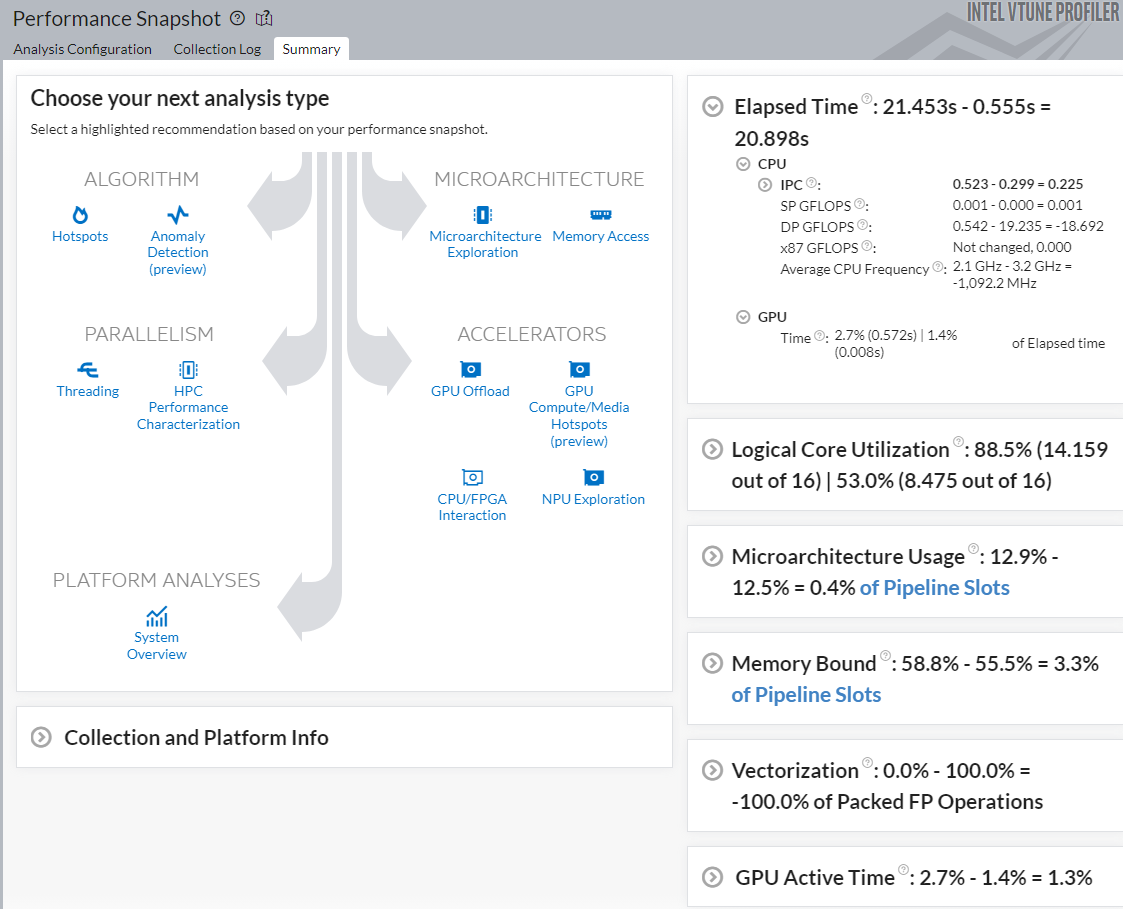
Over the course of this tutorial, you applied several changes to improve the performance of the matrix sample application. Now compare the new performance with the baseline performance which you captured before any optimizations happened.
Compare Performance Before and After Optimization
Compare multiple results of an analysis type in Intel® VTune™ Profiler to observe any changes in performance. When you compare results from different analysis types (such as Hotspots and Performance Snapshot), the comparison is limited to the metrics that are common to both analysis types.
In the VTune Profiler user interface, select Compare Results from the toolbar on the left.
Select the results to compare:
- Result 1 is the original Performance Snapshot result.
- Result 2 is the most recent HPC Performance Characterization result.

Click Compare.
VTune Profiler calculates the differences between metrics that are common to the two analysis types. The result of the comparison displays in the Summary window.

Expand a metric pane to see the difference between metrics that are common to both results.
For example, the Elapsed Time metric for the matrix sample application has now reduced by 20.898 seconds.
Congratulations on completing this tutorial!