Run Performance Snapshot
Establish a baseline for application performance. Run the Performance Snapshot analysis and interpret your result.
Run the Performance Snapshot analysis to get an overall assessment of problem areas in your application. You can then focus on solving the most acute problems to get maximum performance gain. This analysis type also identifies other analysis types you can use to investigate bottlenecks.
Open the Matrix Sample Project
Start your performance analysis by creating a project for your application. A project is a container that holds analysis target configuration and data collection results.
Intel® VTune™ Profiler contains a sample project that is pre-configured to work with the matrix sample application.
Open the matrix project:
Open the VTune Profiler GUI:
Set appropriate environment variables. Run this script:
<install-dir>\env\vars.bat
For VTune Profiler, the default <install-dir> is:
[Program Files]\Intel\oneAPI\vtune\<version>
Run the application.
Find the VTune Profiler icon in the Start menu. Right-click on the icon and run VTune Profiler as administrator.
When the VTune Profiler welcome screen displays, the sample (matrix) project is open in Project Navigator. If you do not see the project, open it manually:
Click the
 Menu button.
 Select Open > Project.
Browse to the matrix project on your local machine and click Open.
The default location for the sample (matrix) project is:
[Users]\<user>\Documents\VTune\Projects\sample (matrix)
This tutorial uses the pre-built matrix sample application. When you analyze your own application, make sure to build it in the Release mode with full optimizations. Also establish a performance baseline before running a complete analysis. For more information on preparing a Windows* target, see the Windows Targets section of the User Guide.
For consistent performance data, minimize the number of other applications that run on your system during performance analysis.
Run Performance Snapshot

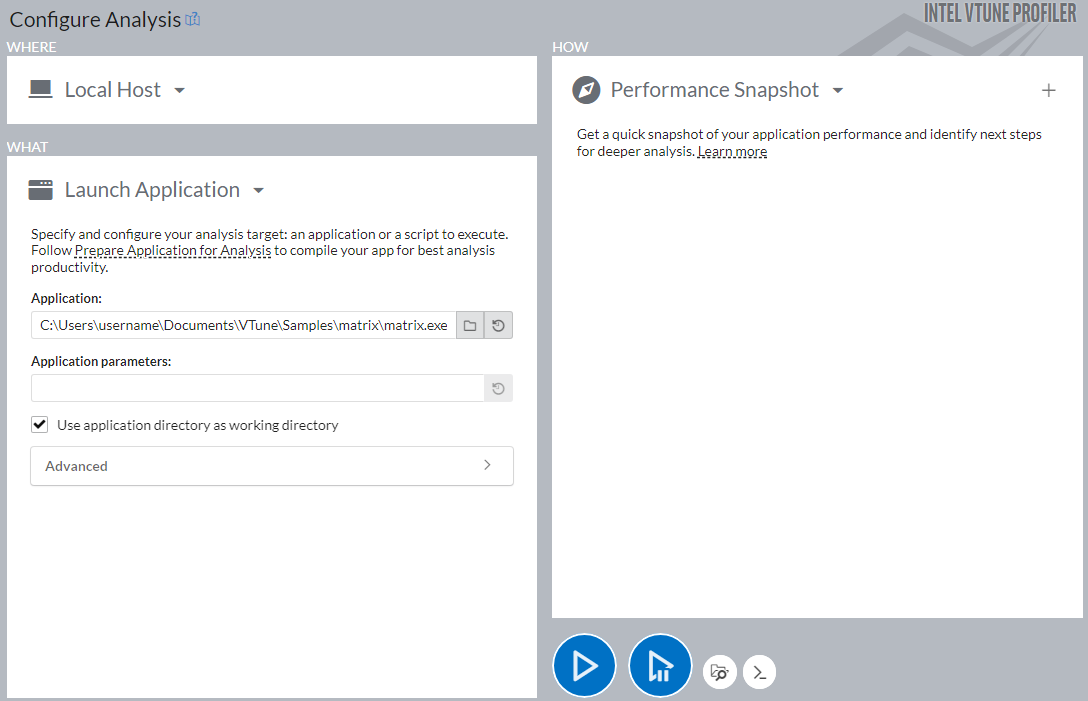
Click the Configure Analysis button to begin a new analysis. The default analysis is pre-configured for the Performance Snapshot analysis type to profile the matrix application on the local system.
Click the Start button to run the analysis.
When data collection is complete, VTune Profiler finalizes the collected results and opens the Summary viewpoint of the Performance Snapshot analysis.