Interpret Your Performance Snapshot Result
Identify the main problem areas in the matrix application.
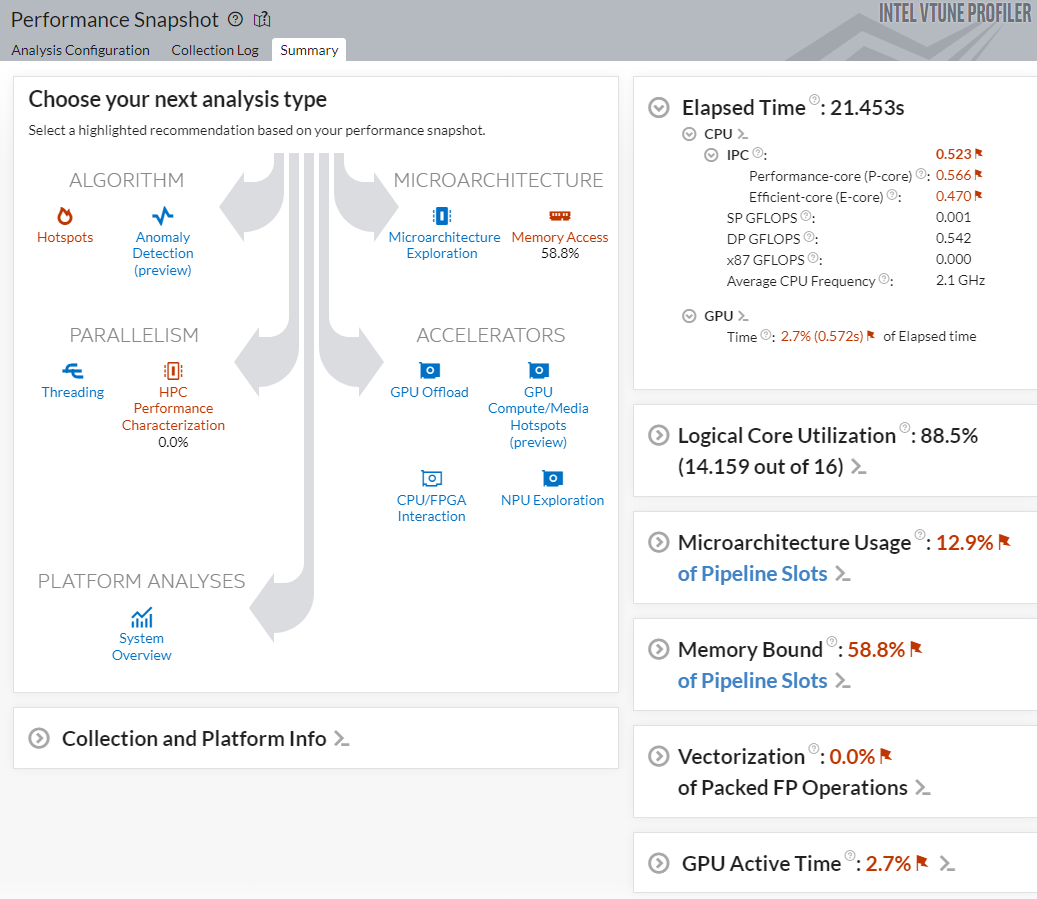
Once the Performance Snapshot analysis is finished, the Summary window displays the result.
Understand the Summary

In the Summary window,
- In the Analysis Tree diagram, look for analysis types you should consider to investigate performance issues. These analysis types are highlighted in red.
- To estimate the severity of an issue, see highlighted metrics in the right pane. Expand a metric to see lower-level metrics that contribute.
- To learn about the system you used to run Performance Snapshot, expand Collection and Platform Info. This information can be useful when you compare results across different hardware platforms.
Identify Problem Areas
In the matrix sample, observe these indicators that highlight some performance bottlenecks:
The Elapsed Time for this application is high.
The IPC (Instructions per Cycle) metric value is very low for a modern superscalar processor which is typically capable of completing ~4 instructions per cycle. This low value for IPC indicates that the processor was stalled for most of the run time.
Expand the Microarchitecture Usage section to further understand the low value for IPC. You see that instructions are bound by DRAM accesses. This substantiates the next section which informs you that the application is memory bound.
The Vectorization section informs you that there is no vectorization happening, even though the sample application has floating point operations.
At this point, you observe the following potential performance issues with analysis types that can help you investigate each of them. Additionally, Performance Snapshot recommends another analysis type - Hotspots analysis.
| Performance Issue | Analysis Type for Further Investigation |
|---|---|
| Hotspots analysis | |
| No Vectorization | HPC Performance Characterization analysis |
| Memory Access | Memory Access analysis |
The Hotspots analysis identifies hot spots, which are areas of code that contributed the most to the elapsed time. In large applications, this analysis is a good starting point to understand algorithm flow and identify the hottest functions in different sections of code. Since the matrix sample is small and has only one primary function, the hot spot is likely to be in the primary function. Rather than running the Hotspots analysis to confirm this detail, you may find it more useful to examine the root cause behind the performance problem.
Vectorization increases the ability to execute more operations in parallel. However, the low IPC metric value causes all instructions to execute slowly. Therefore, improving vectorization before improving the IPC rate would not necessarily improve application performance.
For this reason, prioritize improving the IPC metric first. To do this, run the Memory Access analysis to further understand why the application is memory-bound.