Tutorial
Find Hotspots (L2 Cache)
The following steps show how to find hotspots at the L2 cache level.
As an example, the tutorial uses the sample application, tcc_cache_allocation_sample. Although this sample is already tuned with the cache allocation library, it can simulate an untuned application when configured to allocate the buffer in DRAM.
First, you will run the sample using DRAM and observe the number of cache misses. Then you will run the sample again, using a buffer in L2 cache. You can expect to see fewer cache misses.
Run the Sample Using DRAM (Baseline)
Make sure that you can SSH from your host system to the target system. Run ifconfig on the target to get the IP address.
On the target system, open a terminal window and run the Linux* tool stress-ng as a noisy neighbor:
taskset -c 3 stress-ng -C 10 --cache-level 2
On the host system, launch VTune™ Profiler and create a project.
In the WHERE section, specify the target system as follows:
Click the
 Browse button.
Select Remote Linux (SSH).
For SSH destination, specify the address of the target system root@<IP address> OR root@<hostname>.

Click the
 Deploy button if required.
In the WHAT section, specify the following information to run the sample:
For Application, type tcc_cache_allocation_sample.
For Application parameters, type --latency 300 --sleep 100000000.

When the HOW section is visible, configure the analysis as follows:
Click the
 Browse button.
Under Microarchitecture, select Memory Access.

Click the
 Copy button to customize the analysis.
Optional: Select Collect stacks:

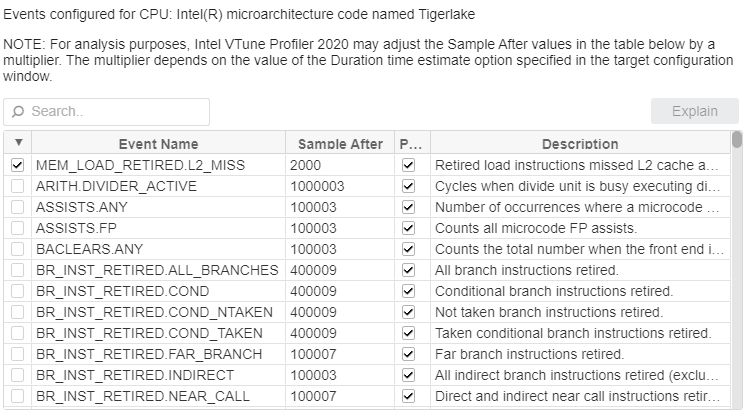
Under Events configured for CPU, select MEM_LOAD_RETIRED.L2_MISS for 11th Gen Intel® Core™ and Intel® Xeon® W-11000E Series processors or MEM_LOAD_UOPS_RETIRED.L2_MISS for Intel Atom® x6000E Series processors. Set Sample After to 2000 and deselect other settings (the performance of the real-time system may be affected by interrupts caused by extra VTune™ Profiler counters).

Optional: Select Analyze loops to collect advanced information such as instruction set usage, and display analysis results by loops and functions.

Optional: Scroll down and select Analyze memory objects.

Click the
 Start button to run the analysis.
Go to the Event Count tab.
Maximize the screen if it is smaller than the full size of your monitor.
Select Grouping by Task Type/Function/Call Stack
At the top of the screen, find the MEM_LOAD_RETIRED.L2_MISS column. Click the column to sort the rows by number of cache misses. In this example, the function pointer_chase_read_workload_internal is at the top of the list with 50,000 misses, which means the function is the hotspot for this type of event, and the buffer is a candidate for the cache allocation library.

Follow the instructions below to run the sample using the cache allocation library to allocate a buffer in L2 cache. Compare the results.
Run the Sample Using L2 Cache
At the top left of the screen, click the
 Configure Analysis button.
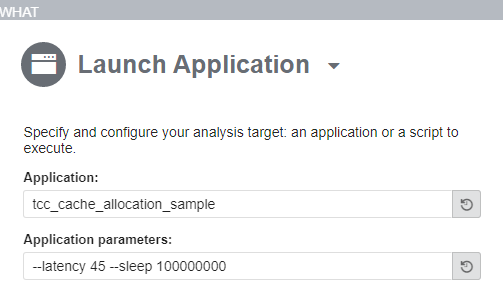
In the WHAT section, change the Application parameters to --latency 45 --sleep 100000000. This command allocates the buffer in L2 cache.

Click the
 Start button to run the analysis.
After the analysis is complete, go to the Event Count tab.
By using an L2 cache buffer, the number of cache misses for function pointer_chase_read_workload_internal is lower or not in the list, as in the screenshot below, because there were no misses for this function.
