Energy Analysis Workflows
Use Intel® SoC Watch and Intel® VTune™ Profiler to collect and analyze power and energy consumption metrics. You can collect data on Windows, Linux, or Android systems. Use this data to identify system behaviors that waste energy.
There are two ways in which you can run energy analysis:
- Get a snapshot of energy consumption metrics through the Intel® VTune™ Profiler user interface.
- Run a comprehensive analysis using Intel® SoC Watch (available in Intel® VTune™ Profiler) and view results in Intel® VTune™ Profiler.
Get Snapshot through Intel® VTune™ Profiler
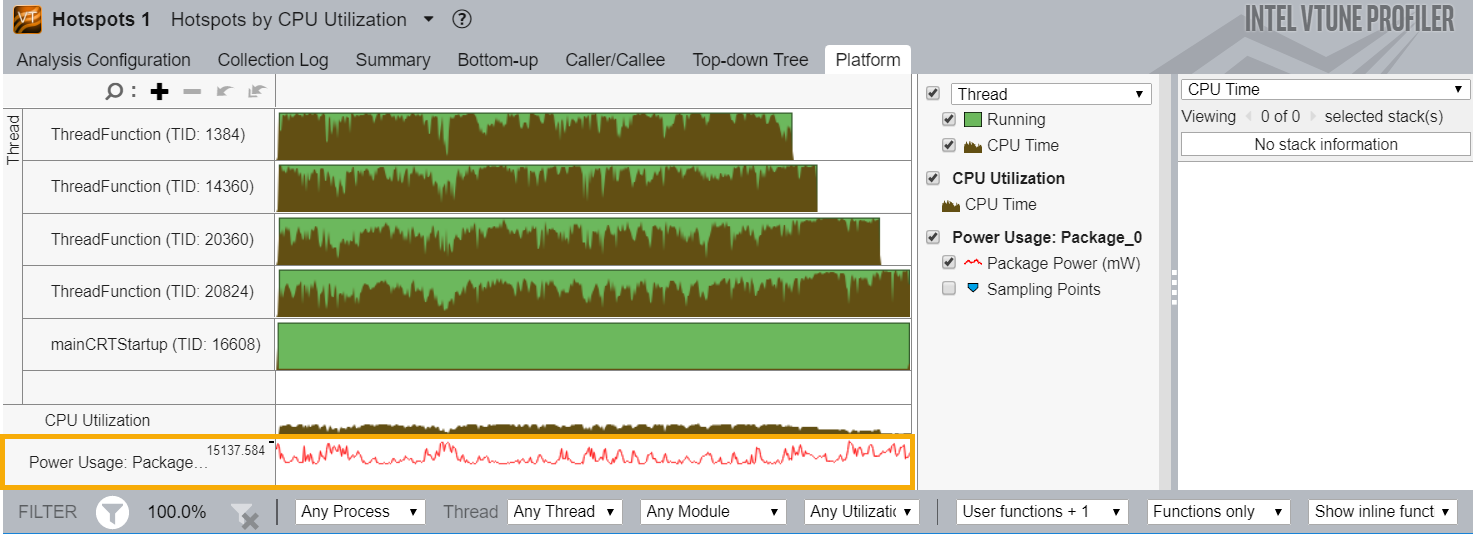
In the snapshot view, you can observe package power consumption over time when you run any analysis type in Intel® VTune™ Profiler. This option is available when you run VTune Profiler on Windows, Linux, or Android systems.
- On the VTune Profiler welcome screen, click Configure Analysis.
- In the HOW pane, select an analysis type. In this example, we use the Hotspots analysis.
- Customize a copy of the analysis. Click this icon:

- Select options as necessary.
- At the bottom of the analysis type, check Analyze power usage.

- Click Start(
 ) to run the analysis.
When the analysis completes, VTune Profiler displays package power usage information (collected by Intel® SoC Watch) in the Platform tab.

Track package power usage to see if the CPU is likely to enter a throttling phase. If that happens, you can run a throttling analysis to explore possible causes.
Run Comprehensive Analysis using Intel® SoC Watch
Use Intel SoC Watch as a command line tool on a target system running on Windows, Linux, or Android OS. To install and use Intel SoC Watch, see the Intel SoC Watch User's Guide for Windows or Linux and Android.

- Install Intel® VTune™ Profilerwhich includes Intel® SoC Watch.
- Copy the vtune_profiler_target from the Intel® VTune™ Profiler installation directory to the target system.
- Extract vtune_profiler_target to install Intel SoC Watch on the target system.
- Set up a scenario for energy analysis.
- Run data collection.
- Review a summary report on the target or host.
For more information, see:
- Intel® SoC Watch Release Notes for the appropriate operating system
Intel® SoC Watch is available in VTune Profiler, which you can download with the Intel® oneAPI Base Toolkit.
Once you install VTune Profiler, copy the vtune_profiler_target from the Intel® VTune™ Profiler installation directory to the target system.
Extract vtune_profiler_target to install Intel SoC Watch on the target system.
On the target system, set up the scenario to be analyzed for energy usage and run the data collection using Intel SoC Watch. Include the -r vtune option to write a result file that can be imported to VTune Profiler. You can perform data collection on an idle system or run it concurrently with a workload that started at any time before or during the collection.
For example, to run a collection that performs these tasks:
- For 1 minute (-t 60)
- Gather data about how much time the CPU spends in low power states (-f cpu-cstate)
- Include trace data (-m)
- Store the reports in a specified directory location with the specified file name (-o results/test)
- import into VTune Profiler (-r vtune)
socwatch -t 60 -f cpu-cstate -m -o results/test -r vtune
The import file is saved to the results directory as test.pwr.
For detailed descriptions of options and the different metrics that can be collected, see Intel® SoC Watch Command Options or the Getting Started section of the Intel® SoC Watch User's Guide (Linux and Android | Windows).
Use feature group names as a shorthand for specifying several features (metrics) that should be collected at the same time. For instance, -f sys collects many commonly used metrics, including low power state residency for CPU, GPU, and devices, CPU temperature and frequency, and memory bandwidth.
Use the --help option to discover all of the available metrics that can be collected on the system (found under feature and feature group names) as well as other options for controlling data collection and reporting.
Review the summary report generated by Intel SoC Watch on the target system or copy to the host for viewing. Reports are created in a comma-separated file format (CSV) and stored in a location relative to the directory from which Intel SoC Watch was run. By default, you can find the summary report in the current directory in the SOCWatchOutput.csv file.
Copy the import result file (test.pwr) from the target system to the host system.
Import the file to a VTune Profiler project:
Launch VTune Profiler GUI on the host system.
Open/Create a project.
Click the
 Import Result button on the toolbar and browse to the test.pwr file.
 The results are opened in the default Platform Power Analysis viewpoint. For more information about viewing data in Intel VTune Profiler and the Platform Power Analysis viewpoint, see the Intel VTune Profiler help.
For detailed instructions on using Intel SoC Watch to run energy analysis, see Running Energy Analysis with Intel® VTune™ Profiler.