Visible to Intel only — GUID: tub1577820760299
Ixiasoft
2.2.1. Timing Path and Clock Analysis
2.2.2. Clock Setup Analysis
2.2.3. Clock Hold Analysis
2.2.4. Recovery and Removal Analysis
2.2.5. Multicycle Path Analysis
2.2.6. Metastability Analysis
2.2.7. Timing Pessimism
2.2.8. Clock-As-Data Analysis
2.2.9. Multicorner Timing Analysis
2.2.10. Time Borrowing
3.1. Timing Analysis Flow
3.2. Step 1: Specify Timing Analyzer Settings
3.3. Step 2: Specify Timing Constraints
3.4. Step 3: Run the Timing Analyzer
3.5. Step 4: Analyze Timing Reports
3.6. Applying Timing Constraints
3.7. Timing Analyzer Tcl Commands
3.8. Timing Analysis of Imported Compilation Results
3.9. Using the Intel® Quartus® Prime Timing Analyzer Document Revision History
3.10. Intel® Quartus® Prime Pro Edition User Guide: Timing Analyzer Archive
3.5.1.1. Report Fmax Summary
3.5.1.2. Report Timing
3.5.1.3. Report Timing By Source Files
3.5.1.4. Report Data Delay
3.5.1.5. Report Net Delay
3.5.1.6. Report Clocks and Clock Network
3.5.1.7. Report Clock Transfers
3.5.1.8. Report Metastability
3.5.1.9. Report CDC Viewer
3.5.1.10. Report Asynchronous CDC
3.5.1.11. Report Logic Depth
3.5.1.12. Report Neighbor Paths
3.5.1.13. Report Register Spread
3.5.1.14. Report Route Net of Interest
3.5.1.15. Report Retiming Restrictions
3.5.1.16. Report Reset Statistics
3.5.1.17. Report Pipelining Information
3.5.1.18. Report Time Borrowing Data
3.5.1.19. Report Exceptions and Exceptions Reachability
3.5.1.20. Report Bottlenecks
3.6.1. Recommended Initial SDC Constraints
3.6.2. SDC File Precedence
3.6.3. Modifying Iterative Constraints
3.6.4. Using Entity-bound SDC Files
3.6.5. Creating Clocks and Clock Constraints
3.6.6. Creating I/O Constraints
3.6.7. Creating Delay and Skew Constraints
3.6.8. Creating Timing Exceptions
3.6.9. Using Fitter Overconstraints
3.6.10. Example Circuit and SDC File
3.6.8.5.1. Default Multicycle Analysis
3.6.8.5.2. End Multicycle Setup = 2 and End Multicycle Hold = 0
3.6.8.5.3. End Multicycle Setup = 2 and End Multicycle Hold = 1
3.6.8.5.4. Same Frequency Clocks with Destination Clock Offset
3.6.8.5.5. Destination Clock Frequency is a Multiple of the Source Clock Frequency
3.6.8.5.6. Destination Clock Frequency is a Multiple of the Source Clock Frequency with an Offset
3.6.8.5.7. Source Clock Frequency is a Multiple of the Destination Clock Frequency
3.6.8.5.8. Source Clock Frequency is a Multiple of the Destination Clock Frequency with an Offset
Visible to Intel only — GUID: tub1577820760299
Ixiasoft
3.5.1.11. Report Logic Depth
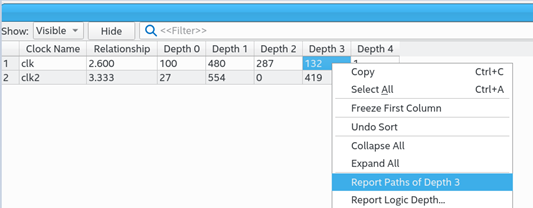
The Timing Analyzer's Reports > Design Metrics > Report Logic Depth... command allows you to report the number of logic levels within a clock domain. This value typically corresponds to the number of look-up tables (LUTs) that a path passes through.
The equivalent scripting command is report_design_metrics -logic_depth. Report Logic Depth shows the distribution of logic depth among the critical paths, allowing you to identify areas where you can reduce logic levels in your RTL.
Figure 58. Report Logic Depth (Histogram)
Figure 59. Report Paths of Depth 3Call report logic depth by topology for each clock, intraclock only.


Figure 60. Summary of PathsClose timing with accurate histogram cross probing.


You can specify various options to customize the reporting.
| Option | Description |
|---|---|
| Clocks | From Clock and To Clock filter paths in the report to show only the launching or latching clocks you specify. |
| Targets | Specifies the target node for From Clock and To Clock to report logic depth with only those endpoints. Specify an I/O or register name or I/O port for this option. The field also supports wildcard characters. When the From, To, or Through boxes are empty, the Timing Analyzer assumes all possible targets in the device. The Through option limits the report for paths that pass through combinatorial logic, or a particular pin on a cell. |
| Analysis type | The Setup, Hold, Recovery, and Removal analyses report the logic depths of the top X paths by slack. Topology analysis reports the logic depths of the top X paths by logic depth. |
| Paths | Specifies the number of paths to display by endpoint and slack level. The default value for Report number of paths is 10, otherwise, the report can be very long. Enable Pairs only to list only one path for each pair of source and destination. Limit further with Maximum number of paths per endpoints. You can also filter paths by entering a value in the Maximum slack limit field. |
| Detail | Specify whether to display on Histogram or full Path level of detail. |
| Report panel name | Specifies the name of the report panel. You can optionally enable File name to write the information to a file. If you append .htm or .html as a suffix, the Timing Analyzer produces the report as HTML. If you enable File name, you can Overwrite or Append the file with latest data. |
| Tcl command | Displays the Tcl syntax that corresponds with the GUI options you select. You can copy the command from the Console into a Tcl file. |