Visible to Intel only — GUID: cdm1656550926373
Ixiasoft
Visible to Intel only — GUID: cdm1656550926373
Ixiasoft
2.3.2.1.3. Inspecting SDC-on-RTL Constraints
DNI Tcl Console
The DNI Tcl console allows you to experiment conveniently with targeting constraints and the related syntax. For this beta release, the DNI netlist is read-only when accessed from the Tcl console, and constraint commands are not saved into the design database.
quartus_syn --dni -s
Once the Analysis & Elaboration compilation stage completes, you can load the project in the console (project_open <project_name>) and load the appropriate DNI netlist checkpoint using the dni::load_design -checkpoint "constrained" command. You can now perform tasks such as:
- Read a specific SDC file using the dni::read_sdc<file_name> command.
- Dump constraints using the dni::write_sdc command.
- Run constraint commands that are limited to the local session. For more information, refer to Creating Constraints in SDC-on-RTL SDC Files.
RTL Analyzer
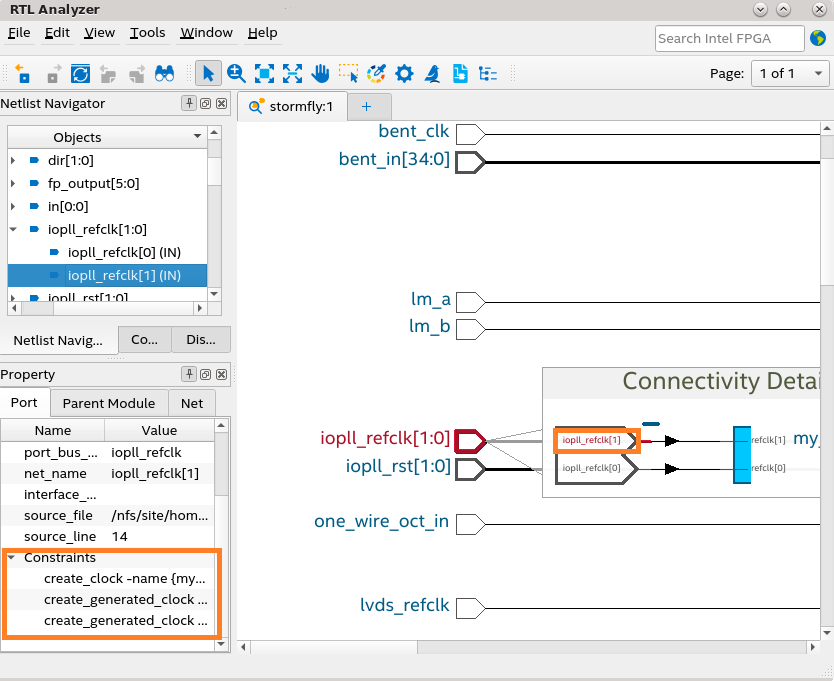
After Analysis and Elaboration, you can invoke the RTL Analyzer (Constrained mode) from the compilation dashboard. The RTL Analyzer GUI allows you to view the constraints on the elaborated design netlist. When you select a netlist object in the semantic viewer, you can view constraints targeting that object in the Property viewer. This helps ensure the constraints target the intended nodes in your RTL.
In the following image, you can observe that the iopll_refclk[1] port has three constraints:

- To view the connectivity details, right-click on a port and click Display individual bits.
- You can cross-probe the SDC file by right-clicking on a constraint in the Property viewer and selecting the View in Source option.
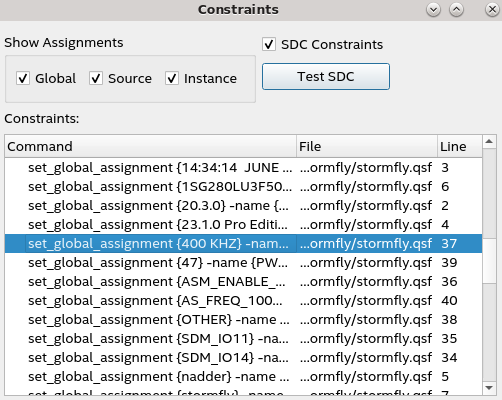
Additionally, from the RTL Analyzer menu, you can also launch the Constraints dialog box (Tools > Object Constraints) to view a list of all constraints. Additionally, you can select an assignment or a constraint from the Constraints viewer and cross-probe to its source file by right-clicking and selecting View in Source. The source file that contains the assignment or constraint launches in the Intel® Quartus® Prime GUI with the line of the assignment highlighted.

Intel® Quartus® Prime Timing Analyzer
The Intel® Quartus® Prime Timing Analyzer uses industry-standard constraint and analysis methodology to report on all data required times, data arrival times, and clock arrival times for all register-to-register, I/O, and asynchronous reset paths in your design. The Timing Analyzer verifies that the required timing relationships are met for your design to function correctly and confirms actual signal arrival times against the constraints you specify. For more information about the Timing Analyzer, refer to the Intel® Quartus® Prime Pro Edition User Guide: Timing Analyzer .
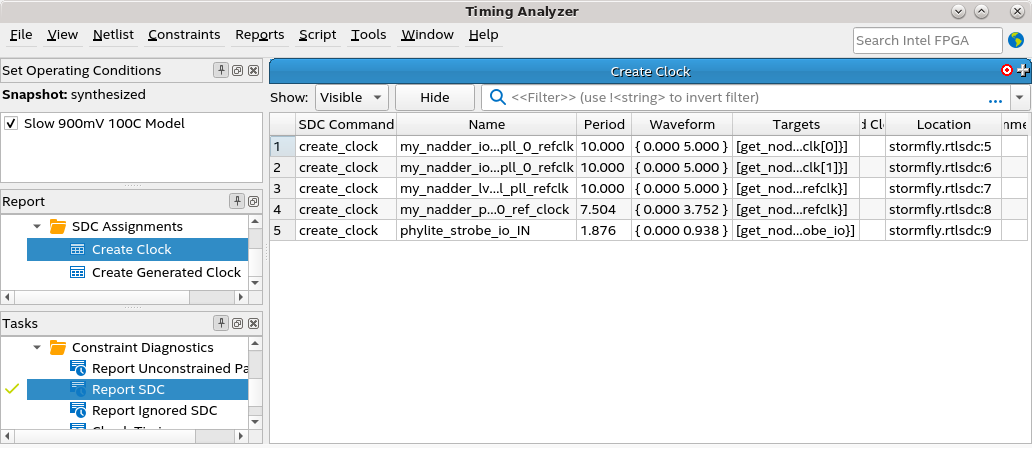
Using the Timing Analyzer GUI or Tcl command console, you can load SDC-on-RTL constraints into the timing analysis session by running the read_sdc command. By default, the read_sdc command always loads SDC-on-RTL constraints, which happens before loading other conventional Intel® Quartus® Prime software SDC files (SDC_FILE or SYN_SDC_FILE). To disable the loading of SDC-on-RTL constraints during the calls to read_sdc, use the read_sdc -no_import option or set the QSF variable ENABLE_IMPORT_SDC_DURING_READ_SDC to OFF.
During static timing analysis, you can load only the SDC-on-RTL SDC constraints using the import_sdc command. This is helpful when debugging issues you suspect are caused by SDC-on-RTL constraints.
Once you import the constraints using the read_sdc or import_sdc command, they become standard constraints in the Timing Analyzer. Standard constraint diagnostic reports (report_exceptions, report_sdc, and so on) operate on these constraints, and you can update the constraints for the current Timing Analyzer session using the existing Intel® Quartus® Prime timing analysis API commands.
