Optimize Memory-bound Applications with GPU Roofline
This section explains how to identify performance problems of GPU applications and understand their reasons using the GPU Roofline Insights perspective of the Intel® Advisor.
When developing a GPU application with SYCL or OpenMP programming model, it is important to keep in mind kernel parallel execution. Usually, massive and uneven memory access is the main problem that limits the GPU performance. If the path between a memory level where global data is located and GPU execution units is complex, the GPU might be stalled and wait for data because of bandwidth limitations at different stages on the path. Understanding these stages and measuring data flow on the path is an essential part of performance optimization methodology. GPU Roofline Insights perspective can help you to analyze bottlenecks for each kernel and quickly find the data path stage that causes the problem. A typical method to optimize GPU execution algorithms is reconsidering data access parents.
Memory Path in Intel® GPU Microarchitecture
Depending on a GPU generation, the compute architecture of Intel® Processor Graphics uses a system memory as a compute device memory, which is unified by sharing the same DRAM with the CPU, or a dedicated VRAM resided on a discrete GPU card.
On an integrated GPU, where DRAM is shared between CPU and GPU, global data can travel form system DRAM through last-level cache (LLC) to a graphics technology interface (GTI) on a GPU. If data is efficiently reused, it can stay in the L3 cache of a GPU where execution units can access it and fetch to an Xe Vector Engine (XVE) register file.
Assuming the fastest way to access data on a system with high bandwidth and low latency is accessing data from registers, the cache-aware Roofline model (CARM) of the Intel Advisor treats it as the most effective access with true, or pure payload, amount of data consumed by an algorithm. Let us call it algorithmic data. For example, for a naive implementation of the matrix multiplication algorithm, theoretically, the amount of data read for each matrix and used for calculations is:
D*M3
where
D is a size of a matrix element, in Bytes
M is a size of a square matrix
If the General Register File (GRF) could theoretically fit all matrix data, the data is transferred from DRAM to GPU only once. Otherwise, the data is transferred from DRAM to the L3 cache and further in parts ordered by memory address access defined by the algorithm. If the calculations reuse data, some portion of it can stay in cache for longer making access faster. Ideally, data used by the algorithm should fit to the L3 cache. In real life, the best situation is when data in the L3 cache is reused as much as possible, and then it is evicted to allow the next portion of data to be reused.
In some cases, data is evicted from L3 cache, but next calculations need it. This creates redundant cache traffic and adds more load to the data path bandwidth. A good indicator for such situation is the L3 cache miss metric.
As data is fetched from DRAM to the L3 cache by cache lines of 64 bytes, accessing data objects that are smaller than the cache line size or cross cache line boundaries creates excessive cache traffic because unnecessary data is yet to be fetched from DRAM. The worst-case scenario is accessing byte-size objects that are randomly resided in global memory spaces. In this case, each access brings extra 63 Bytes of unnecessary data to the L3 cache and the data path is loaded with transferring data overhead (as opposed to algorithmic data).
In addition to the L3 cache, there is shared local memory (SLM), which is a dedicated structure outside of the L3 cache (for the Gen9, it is a part of L3 physically but separated functionally) that supports the work-group local memory address space. SLM can significantly increase GPU performance, but as SLM size is limited, you should carefully select work-group size to leverage performance improvement.
Each stage has a bandwidth limitation. Usually, the further from VE, the lower the bandwidth (similar to CPU memory architecture). Depending on a particular data access pattern implemented by an algorithm, some stages can be a bottleneck for the data flow. A more complex algorithm can have a combination of bottlenecks as data access can be a combination of different patterns.
Intel Advisor GPU Roofline Insights perspective can identify bottlenecks at different stages of data transfer and map the bottlenecks to program source code helping you to focus on performance problems and optimization. In addition to source data provided by the GPU Roofline Insights, you can use other tools to identify data that creates a bottleneck.
GPU Roofline Methodology
Intel Advisor implements the Roofline analysis in two perspectives: CPU/Memory Roofline Insights, which can analyze performance of CPU applications, and GPU Roofline Insights, which can analyze performance of GPU applications. General methodology of a Roofline model focused on the CPU/Memory Roofline is explained in the resources listed in the Roofline Resources for Intel® Advisor Users. You are strongly recommended to learn the Roofline basics before continuing. This recipe explores features of the GPU Roofline Insights perspective for analyzing performance on Intel GPUs.
Roofline Result Overview
Measuring GPU performance with GPU Roofline Insights is quite straightforward (Using GPU Roofline):
1. Run the GPU Roofline Insights with your preferred method: from Intel Advisor GUI or Intel Advisor command line tool.
Open the analysis results and examine a GPU Roofline chart reported. It plots an application’s achieved performance and arithmetic intensity against the machine’s maximum achievable performance.
For example, for the matrix multiply application, the GPU Roofline chart filtered by GTI (memory) level has one red dot representing a GPU kernel.
In the chart, each dot represents a kernel plotted by its measured data and performance characteristics. They are a central point of analysis in two-dimensional coordinates: arithmetic intensity (X axis) and performance (Y axis). Dot location against these coordinates shows the relation of kernel’s performance and its algorithm data consumption to GPU hardware limitations including its maximum computing performance and data flow bandwidth. On the chart, the hardware limitations are shown as diagonal lines, or roofs. The kernel location can help you to figure out two main things:
If there is room for improvement to speed up kernel performance on the current GPU
What the kernel is bound by: compute, cache, or memory bandwidth, and what you can change in the algorithm implementation to go beyond those boundaries to increase performance
This recipe describes only cases for memory- or cache-bound applications.
Kernel Location Calculation
It is important to know why exactly a kernel dot is located at a certain place of the chart for the following reasons.
A kernel is an implementation of an algorithm and it performs a fixed number of compute operations (such as add, mul, mad) with fixed amount of data. For example, for the matrix multiply naive implementation, assuming data is directly brought from memory, the algorithm arithmetic intensity AI is calculated as:
AI = M3 / 3*M2
where:
M is a size of a square matrix
M3 is the number of operations
3*M2 is the amount of read/write data
The algorithm performance P is calculated as:
P = M3 / T
where:
T is time it takes for the operations to complete
M3 is the number of operations
These values AI and P define the location of the kernel dot on the graph.
Let us switch from theoretical calculations to a real-world case. Intel Advisor measures data at run time and is not aware of theoretical number of operations and amount of data the algorithm needs. Each kernel is isolated by an internal instrumenting tool and measured by API tracing. Measured performance P’ is calculated as:
P’ = I’ / T’
where:
I’ is measured number of executed computing instructions
T’ is measured time
Measuring data used in the algorithm is easy only at the stage when VEs fetch data from the GRF because computing instructions have specific data reference syntax, which helps to calculate the amount of bytes used by the kernel. However, this data may come from different sources in the memory hierarchy in the GPU microarchitecture, and the amount of data that goes through different stages can be different.
On the Roofline chart, the kernel dot can be split into multiple dots for different memory levels. The following sections describe each memory level in detail and how Intel Advisor plots them on the Roofline chart.
How do we understand which memory level limits the algorithm execution? The algorithm performance is measured as the number of instructions I’ executed during time T’, and it requires data traffic DXX at each memory stage. Assuming the algorithm is memory bound, at some levels, the data flow should be close to hardware bandwidth, while at other levels, it can be less limited. To identify the most probable bottleneck of the algorithm implementation, you need to find out which dot is the closest to its corresponding memory level roof line. Note that data flows may have more than one bottleneck, and the distance between dots and their corresponding roof lines should be similar.
In the Intel Advisor, double-click a dot on the Roofline chart to quickly find the limiting roof with the shortest distance to the dot and identify the bottleneck. The tool also provides additional hints about memory limitations, but we will review them later.
Performance Optimization Scenarios using GPU Roofline
The Roofline chart does not directly indicate what you need to change in your code to make it run faster on a GPU (although it provides some code hints, or guidance), but it shows a memory locality pattern(s) that dominate in your algorithm implementation. By examining where the kernel dots are located on the chart in relation to memory levels, you can identify the memory stage that is too narrow for the data flow and is the bottleneck. With this information, you can modify the data pattern used in your algorithm and apply, for example, using data blocking to reuse cache, avoiding multiple unnecessary data reads.
The more experience you have, the better you can understand data patterns, but there are basic cases that we can examine. Although, real-life applications do not usually show extreme behavior, like purely bound to a certain roof, as they are affected by:
Auxiliary data transferred between memory and VEs, such as indexes of work-group item calculations, memory addresses arithmetic, loop indexes
Data caching being more complicated as it is affected by the auxiliary data
VE thread scheduling affecting data management
Let us consider several real-life examples of different applications and their implementations similar the theoretical cases discussed earlier.
Data Block Optimized for the Matrix Multiply Algorithm with no SLM Usage
This implementation is a naïve matrix multiply without data blocking and is similar to the optimized kernel and data flow optimization case.
Even though data is not organized in blocks in the source code, the compiler recognizes the pattern and optimizes access to matrix arrays. As a result, we have a high level of data reuse in cache, and kernel performance is limited by the L3 cache. The Roofline chart shows one dot corresponding to a single kernel in the application. Based on its location on the chart:
The kernel is memory bound, and the corresponding dot it close to L3 Bandwidth roof.
GTI data traffic is four times smaller than the L3 cache data traffic, which indicates high data reuse.
CARM and L3 traffics are almost the same, which indirectly indicates 100% of cache line usage because cache lines are fully filled with algorithmic data.
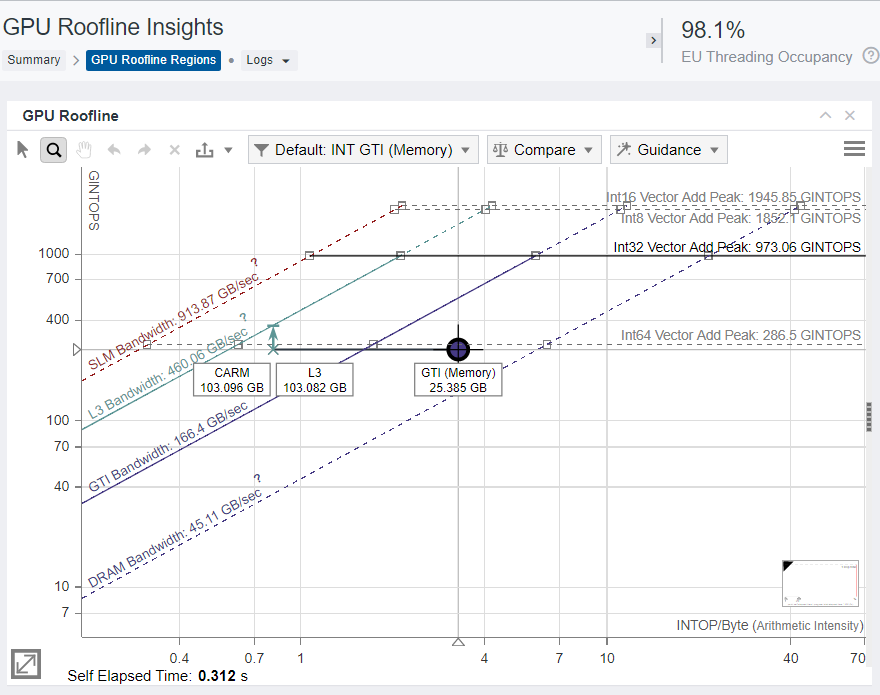
To confirm the 100% of cache line usage, review the L3 Cache Line Utilization metric in the GPU pane grid, which is 100%. The grid also reports VE Threading Occupancy of 98.1%, which indicates good scheduling and data distribution among threads.

To understand the limitations for future kernel code optimization, review the following data reported by the Intel Advisor:
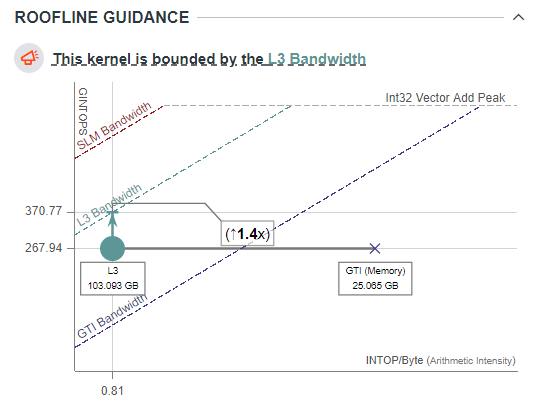
The Roofline Guidance pane shows kernel limitation summary and
provides estimation for possible performance speedup after
optimization. For the matrix multiply kernel, the main limitation
is the L3 cache bandwidth. The kernel can run 1.4x faster if it
uses the L3 cache more effectively and reaches its maximum
bandwidth with the same arithmetic intensity, but a better data
access pattern.
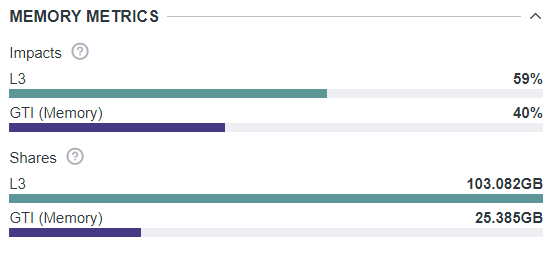
The Memory Metrics pane can help you understand memory level
impact, which is time spent in requests from different memory
levels, in per cent to the total time. For this kernel, GTI has
less impact that L3 cache, but it is still taking a big part of
total kernel execution time and may become a bottleneck after the
L3 bandwidth limits are eliminated, for example, using SLM.
Shares metric is a visual way of estimating data portions processed
from different memory levels. In this case, L3 cache has 4x more
data than GTI.
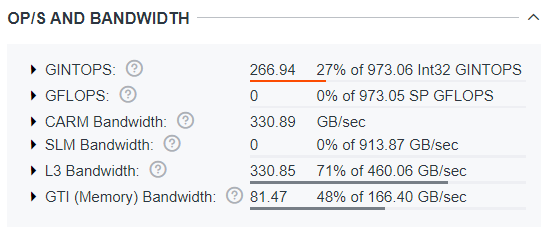
The OP/S and Bandwidth pane shows the number of measured operations per second and data traffic in relation to the bandwidth limitations. For this kernel, the summary reports the following data:
The theoretical SLM bandwidth is almost 3x times higher than the L3 cache bandwidth, but the SLM is not used in this implementation. Blocking matrix arrays to use them as local shared data can eliminate the L3 cache bandwidth limits.
The kernel performance is only 27% of theoretically possible peak performance for Int32 data. With better memory access implementation, we could potentially reach 3x performance increase for this kernel.
Data Block Optimized Matrix Multiply Algorithm with SLM
Following the recommendations from the previous Intel Advisor result, we split the matrix arrays into small blocks to implement matrix multiplication data blocking and put the data blocks to the SLM for faster data reuse on a Xe-core level.
For this optimized implementation with data blocking, the Roofline chart looks as follows:
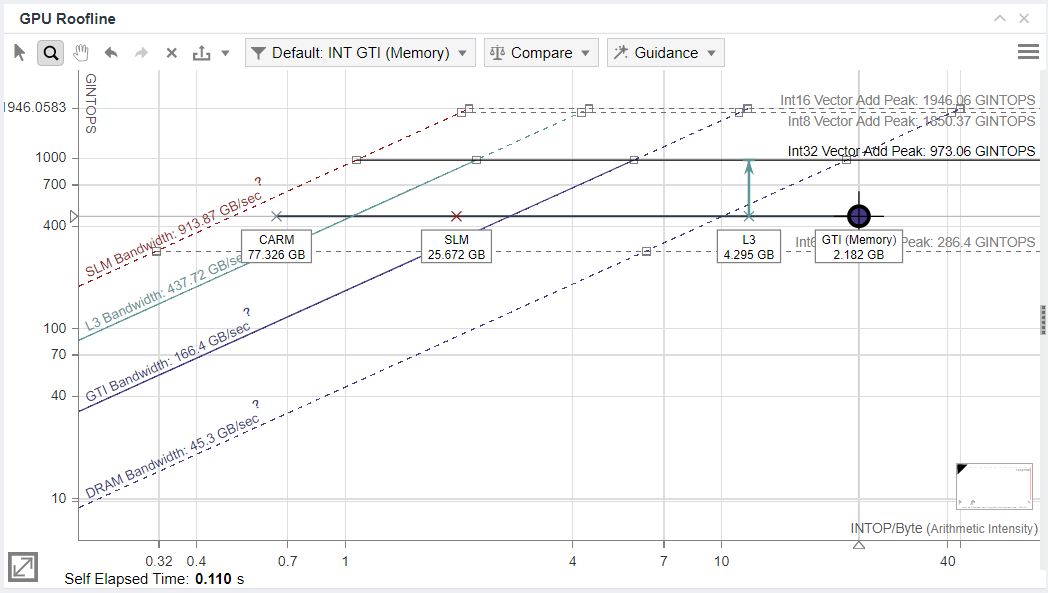
The data distribution has changed from the previous result. Firstly, the execution is not limited to memory, but is compute bound, which is good for overall performance and further optimizations.
There are a couple things to note in the memory-level dots:
SLM traffic is much bigger than L3 traffic. L3 traffic is not zero, which is expected as data blocks are read to L3 cache and then copied to SLM for reuse.
CARM data traffic is three times bigger than the SLM traffic. The reason is not clear from the result, but it is a known effect that happens due to VE data port buffering data brought from SLM and accessed sequentially. This effect is positive and implies data reuse on the memory level closest to VEs.
Let us review data in the GPU Detail pane to understand changes in performance for this algorithm implementation:
As the OP/S and Bandwidth pane shows, the L3 and SLM bandwidth are far from their limits. The kernel performance has increased to 47% of its theoretical limit of integer operations per second (INTOPS).

As the Roofline Guidance chart shows, the kernel performance is limited by the Int32 Vector operations, which are the operations that the compiler used to implement the code. The chart indicates that the kernel can be optimized to run 2.1x faster.

As the Performance Characteristics pane shows, the VEs are stalled
for 43.6% of execution cycles. As the algorithm is fully
vectorized, there should be other reasons for the VE stalls. By
optimizing the VE performance, you might get the 2.1x performance
improvement indicated in the Roofline Guidance pane.

You can run the GPU Compute/Media Hotspots analysis
of the Intel® VTune™ GPU Hotspot analysis to investigate reasons
for the VE stalls further.
Big Data Array with Data Reuse for a STREAM Benchmark
The STEAM benchmark is a small application that brings a big chunk of data from memory and executes basic compute kernels: Copy, Scalar, Add, and Triad. The number of compute operations per kernel is small or equals to 0, so the kernels are expected to be memory bound. For this reason, we use it to define data bandwidth limits in a system.
After analyzing the benchmark with the GPU Roofline Insights on the Intel Processor Graphics code-named Tiger Lake, the Roofline chart shows four dots that correspond to the benchmark kernels. The dots are located on the memory-bound side of the chart below the DRAM bandwidth roof.

The Roofline Guidance chart shows that the kernels are GTI Bandwidth bound, not DRAM bound as the main Roofline chart suggests. The reason for it is that Intel Advisor cannot measure the bandwidth for data transferred between DRAM and XVE on integrated GPUs due to hardware limitations.
The Roofline Guidance suggests you improving cache locality to optimize performance and get better data reuse. This advice is also applicable to other cases when we test data bandwidth and compute performance is not a purpose for optimization.

In the OP/S and Bandwidth pane, review the specific numbers for the achieved memory bandwidth. Notice that CARM, L3, and GTI stages has similar achieved bandwidth, so the bottleneck for this benchmark is the most distant memory interface.

Note here that all stages CARM, L3, and GTI have the similar effective BW and all 3 memory components are roughly identical to each other for a given kernel. Having identical roofline components means that there is no reuse in the cache or register file and every attempt to fetch the data requires accessing all the way down to external memory, because no data is cached any time. This (equal CARM, L3 and External Memory roofline components) is a common indication of “streaming” pattern.
In given case, this also indicates that the most distant memory interface is the bottleneck for this benchmark. Slight difference in kernels BW which is still can be observed is due to Copy/Scale kernels have equal Reads/Writes, while Add/Triad kernels have twice more Reads then Writes, and Read BW is higher on the system.

To eliminate the hardware limitations of the Intel Processor Graphics code-named Tiger Lake that do not allow Intel Advisor to measure bandwidth between DRAM and VE, let us analyze the benchmark running on a discrete Intel® Iris Xe MAX graphics. The resulting Roofline chart shows four kernel dots below the DRAM bandwidth roof.

In the OP/S and Bandwidth pane, Intel Advisor now correctly identifies DRAM as the highest level of bottleneck.

As the OP/S and Bandwidth and Memory Metrics panes show, the DRAM data traffic is very close to its theoretical limit, and the stream benchmark really measures the practical limits of the data flow.

Partially Effective Data Access in a Stencil Data Pattern Benchmark
One of the most interesting cases is when data access is compact but in a very limited local range, while globally, the access is sparse. Such case is frequent in real-life applications, for example, in a stencil-based kernel computation where data in two axes, for example, X and Y, is accessed sequentially in the memory space, but data in Z axis is accessed in a big unit stride.
Let us analyze a 504.polbm applications from the SPEC ACCEL benchmark set running on the Intel Processor Graphics with Gen12 architecture. This benchmark application is written on C with OpenMP* offload to GPU. It works with double-precision numbers, but the Intel Processor Graphics with Gen12 architecture can only simulate the calculations with integer data. That is why we examine the Roofline chart for integer operations.
The GPU Roofline chart shows one dot that correspond to the benchmark kernel. The dot is located between memory and compute roofs, which means that if GPU parameters are changed (for example, if you run the analysis for a hardware with a higher memory bandwidth), the kernel might slightly move from memory bound to compute bound.

As the Roofline Guidance pane shows, the kernel in limited by L3 cache bandwidth. Intel Advisor also detects low cache line utilization for the kernel, which is expected from a stencil-based kernel.

In general, to optimize data access in the stencil-based kernels, you need to apply different techniques that change data layout to use SLM for data locality and SIMD parallelism per data axis. However, you cannot change data layout for benchmarks, and all optimizations are done by the Graphics Compiler.
Conclusion
GPU Roofline Insights perspective of the Intel Advisor is a powerful tool that helps you investigate performance of kernel offloaded to Intel GPUs. It is easier to understand Roofline results for theoretical extreme cases. Such cases have only hardware limitations, so performance optimization strategy is clearer. However, real-life applications might have several limiting factors combined. The Roofline can help you address performance issues by identifying the most contributing factors. Once you eliminate one limitation, the analysis identifies the next factor you can address, until the performance is close to theoretical hardware limitations and optimization stops bringing improvements.