Tutorial
Configure Analysis
Intel® Inspector is a dynamic memory and threading error checking tool for users developing serial and multithreaded applications on Windows* and Linux* operating systems. This topic is part of a tutorial that shows how to find and fix threading errors using the Intel Inspector and a C++ sample application.
Intel Inspector offers a range of preset threading analysis types to help you control analysis scope and cost. The analysis type with the narrowest scope minimizes the load on the system and the time and resources required to perform the analysis; however, it detects the narrowest set of errors and provides minimal details. The analysis type with the widest scope maximizes the load on the system and the time and resources required to perform the analysis; however, it detects the widest set of errors and provides context and the maximum amount of detail for those errors.
To configure a threading error analysis:
Understand the Analysis Type Window
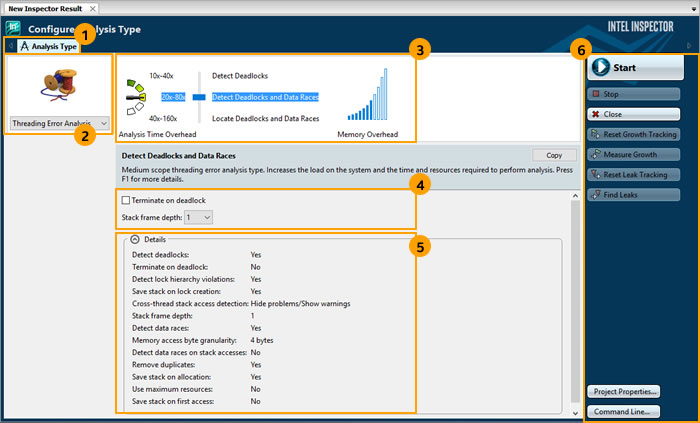
To display an Analysis Type window similar to the following:
Do one of the following:
From the Visual Studio* menu, choose Tools > Intel Inspector [version] > New Analysis....
From the Intel Inspector standalone GUI menu, choose File > New > Analysis....
In the Analysis Type drop-down list, choose Threading Error Analysis.
Use the configuration slider to choose the Detect Deadlocks and Data Races preset analysis type.
Your window may also show three interactive debugger radio buttons.

1 |
Use the Navigation toolbar to navigate among the Intel Inspector windows. The buttons on the toolbar vary depending on the displayed window. |
2 |
Use the Analysis Type drop-down list to choose an analysis type category: Memory Error Analysis, Threading Error Analysis, or Custom Analysis Types.
NOTE:
This tutorial covers threading error analysis types, which you can use to search for data race, deadlock, lock hierarchy violation, and cross-thread stack access errors. Use memory error analysis types to search for resource leak, incorrect memcpy call, invalid deallocation, invalid memory access, invalid partial memory access, memory growth, memory leak, memory not deallocated, mismatched allocation/deallocation, missing allocation, uninitialized memory access, and uninitialized partial memory access errors. |
3 |
Use the configuration slider to choose a preset analysis type and the corresponding gauges to assess the cost of that choice. The preset analysis type at the top of the slider has the narrowest scope; the preset analysis type at the bottom has the widest. The Analysis Time Overhead gauge helps you quickly estimate the time it may take to collect a result using this preset analysis type. Time is expressed in relation to normal application execution time. For example, 10x - 40x is 10 to 40 times longer than normal application execution time. If normal application execution time is 5 seconds, estimated collection time is 50 to 200 seconds. The Memory Overhead gauge helps you quickly estimate the memory the Intel Inspector may consume to detect errors using this preset analysis type. Memory is expressed in blue-filled bars.
NOTE:
The gauge does not show memory used by the running application during analysis. |
4 |
Use the checkbox(es) and drop-down list(s) to fine-tune some, but not all, preset analysis type settings.
NOTE:
If you need to fine-tune more analysis type settings, you can choose another analysis type or create a custom analysis type. |
5 |
Use the Details region to view all current settings for this analysis type. |
6 |
Use the Command toolbar to control analysis runs and perform other functions. For example, use the Project Properties button to display the Project Properties dialog box, where you can change the default result directory location, set parameters to potentially speed up analysis, and perform other project configuration functions. Use the Command Line button to open the Corresponding inspxe-cl Command Options dialog box, where you can review - and, if desired, copy to the clipboard - the command to perform the same analysis using the Intel Inspector command line interface (inspxe-cl command). |
Choose a Threading Error Analysis Type
Make sure your settings match those in the image above before proceeding. If any interactive debugger radio buttons are displayed, make sure the Analyze without Debugger radio button is selected.