Tutorial
Choose Problem
Intel® Inspector is a dynamic memory and threading error checking tool for users developing serial and multithreaded applications on Windows* and Linux* operating systems. This topic is part of a tutorial that shows how to find and fix threading errors using the Intel Inspector and a C++ sample application.
To start exploring a detected threading error:
Understand Key Terms
code location: A fact the Intel Inspector observes at a source code location, such as a write code location. Previously called an observation.
problem: One or more occurrences of a detected issue, such as an uninitialized memory access. Multiple occurrences have the same call stack but a different thread or timestamp. You can view information for a problem as well as for each occurrence.
problem set: A group of problems with a common problem type and a shared code location that might share a common solution, such as a problem set resulting from deallocating an object too early during application execution. You can view problem sets only after analysis is complete.
See the Intel® Inspector Glossary for more key terminology.
Understand Summary Window Panes
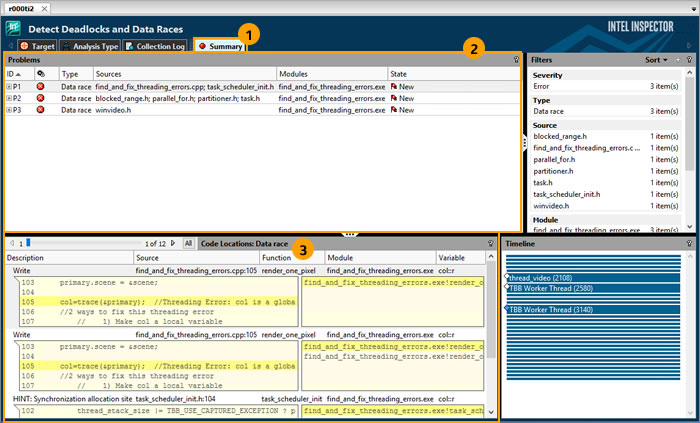
A Summary window similar to the following automatically displays after analysis completes successfully.

1 |
The Summary window is the starting point for managing result data. It groups problems into problem sets and then prioritizes the problem sets by severity and size. |
2 |
Think of the Problems pane as a to-do list. Start at the top and work your way down. Try viewing the problems in various problem sets by clicking the corresponding |
3 |
The Code Locations pane shows the code location summary, surrounding source code snippet, and call stack information for all code locations in one or all occurrences of the problem(s) highlighted in the Problems pane. Try using the various controls on the slider to view information for different occurrences of the highlighted problem. |
Choose a Problem
When you are finished experimenting:
Click the
 icon for the Data race problem set in the find_and_fix_threading_errors.cpp source file to view all the problems in the problem set.
 Double-click the data row for the first Data race problem in the problem set to display the Sources window, which provides more visibility into the cause of the error.