Visible to Intel only — GUID: GUID-CA8D246E-04F0-4B6F-BC5C-91A0FEA0116E
Visible to Intel only — GUID: GUID-CA8D246E-04F0-4B6F-BC5C-91A0FEA0116E
Open Trace Capture
Use the Open Trace Capture window to select and open your trace file.
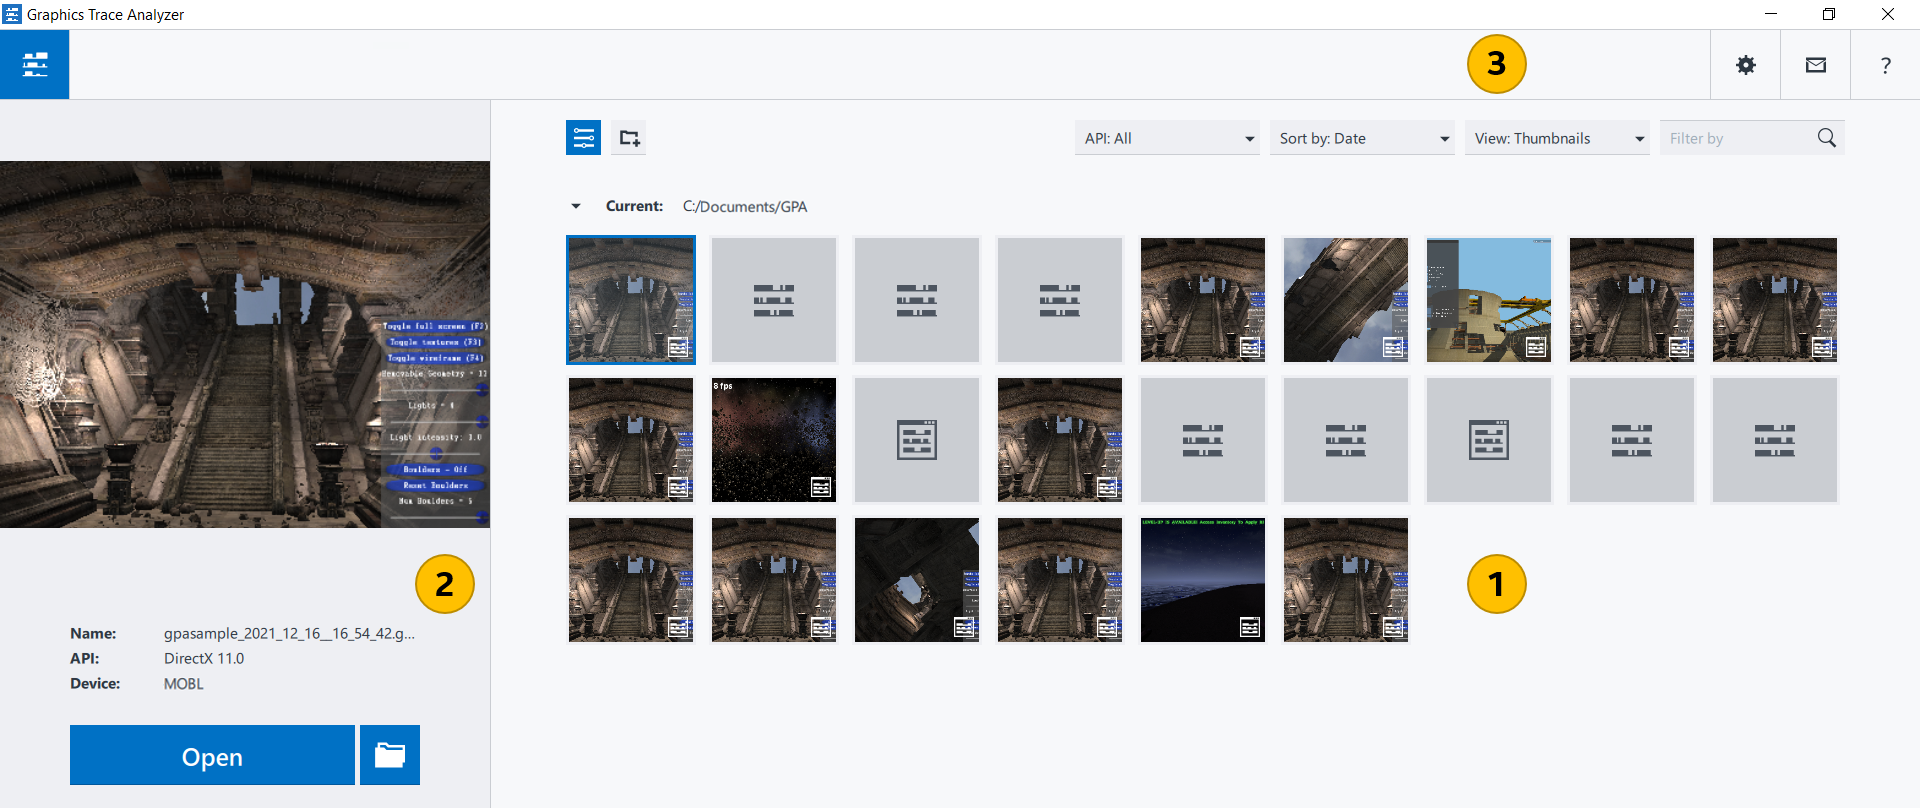
To access the Open Trace Capture window, in the Intel® GPA context menu, select Graphics Trace Analyzer. On Windows* OS, if you opted to enable context menu entries during installation, you can also open trace files using the Windows context menu.

|
Trace Capture Thumbnails pane Select the trace capture you want to debug. By default, this field lists all trace captures located in your Intel GPA home directory: %USERPROFILE%\Documents\GPA (Windows* OS). You can sort the trace captures by name or date with the Sort by button. If there are no trace captures on your system, these toggle buttons are hidden. The currently selected trace capture is highlighted with blue borders and appears in the trace preview pane. Trace file thumbnails are marked with the To delete captured traces, hover the mouse pointer over a trace thumbnail and click the Close button in the top right-hand corner of the thumbnail. Confirm your choice by clicking Yes on the thumbnail. |
|
Preview pane
To rename the selected trace capture, you can click its filename and enter a new value. Click Open, to open the selected trace in the Platform View. Click the |
|
Message pane View the Intel GPA messages or notifications. |
Type filter expression field |
Filter the displayed trace capture files by typing in a part of the trace file name. |
|
Click to capture new traces with Graphics Monitor. |
|
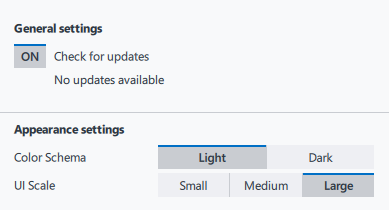
Manage Graphics Trace Analyzer settings: If a newer version of the product is available, the Settings button is marked with the exclamation mark. To download the update, click the Settings button and select the available version from the context menu.
NOTE:
During this check, Graphics Trace Analyzer collects information about your host system. No personally identifiable information is collected.
|
|
Open Intel GPA online documentation. |
