Visible to Intel only — GUID: GUID-693D3C4E-CA4E-4FA2-8920-8275955B3F70
Visible to Intel only — GUID: GUID-693D3C4E-CA4E-4FA2-8920-8275955B3F70
Configure a Metric Set
Intel® GPA supports a wide variety of metrics. The metrics available for display might differ depending on your specific graphics device. With the GPA, you can collect two types of metrics:
Metrics related to frames of the target application. For example, the quantity of draw calls or executed pixel shaders within a frame. In Trace Analyzer, you can use these metrics to understand characteristics of a separate frame such as the duration of pixel or vertex shader execution.
Time-based metrics related to the system in general. For example, the percentage of time during which the GPU is busy. You can use these metrics to understand whether your application is CPU- or GPU-bound.
To configure the metrics that are collected, do the following:
Start the Graphics Monitor.
On the Graphics Monitor Launcher screen, click the Options button.
Go to the Metrics tab and configure the available metrics options:
Select the GPU Sampling Interval
Customize the Heads-Up Display (HUD) position
Configure the HUD metrics
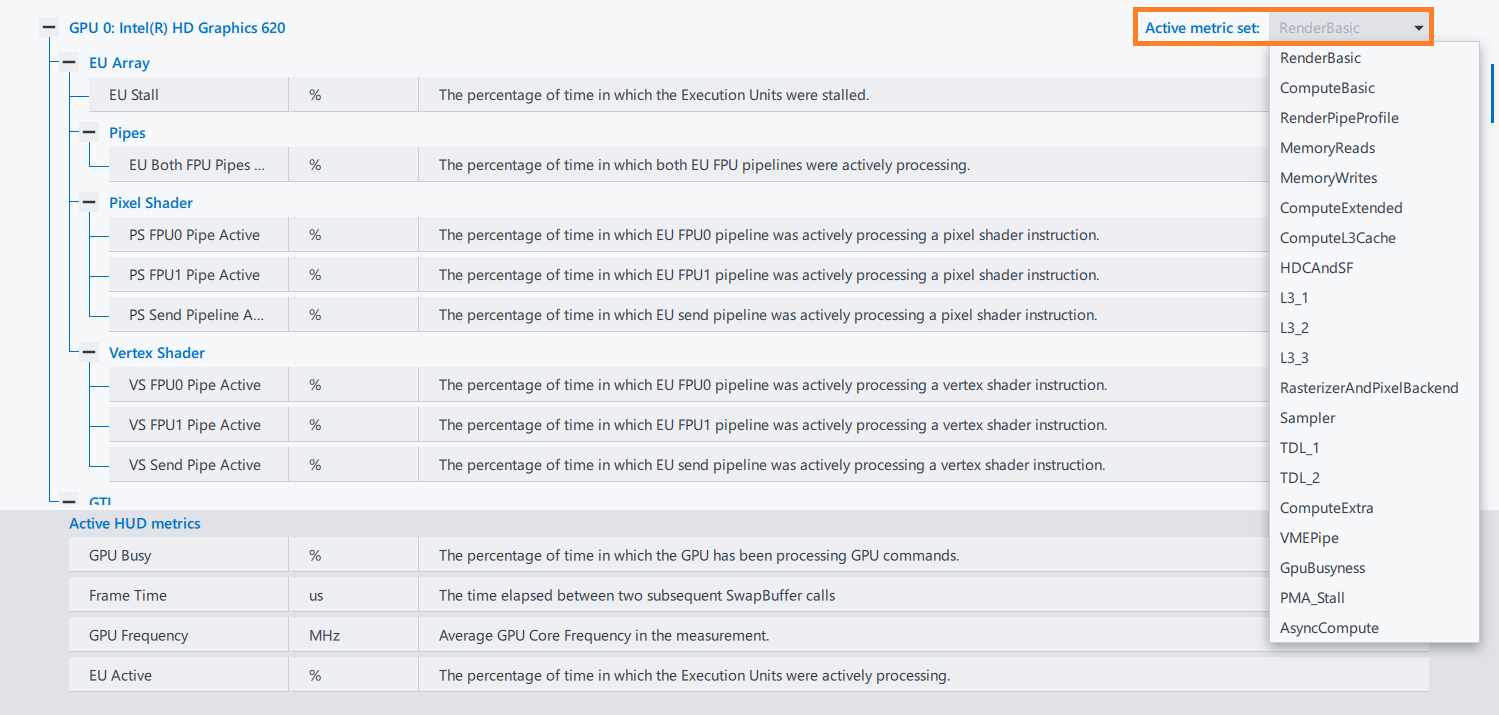
Select the active metric set
Change a D3D Device for the Instrumented Process (Windows* only)
Select the GPU Sampling Interval
You can set GPU Sampling interval to any value from the list (400, 200, 100, 50, 25, 12 microseconds) for system-wide time-based metric collection. Graphics Monitor collects metrics from the entire system with the selected frequency.
The interval is much shorter than the typical frame duration so that you can analyze metrics inside the frame for low-level analysis with high metrics granularity.
Below you can see an example of how the metrics for the interval of 13 milliseconds are displayed in the Trace Analyzer when the GPU sampling interval is set to 400 microseconds:

- This mode may interfere with profiling if other GPU-intensive applications are running. Close other GPU-intensive applications when using any sampling interval.
Short sampling interval can lead to performance issues on some systems, although it allows you to collect more data. The larger the interval, the smaller the file size and the faster the file opens.
Select the Active Metric Set
You can use the predefined sets of GPU metrics to focus your analysis on particular issues, for example, rendering or compute.
GPU metrics are logically split into metric sets. For the analysis, you can use one metric set at a time due to GPU restrictions. The choice depends on the game and the focus of your analysis. For example, you can choose RenderBasic set to get rendering details and ComputeBasic set to look into computing issues.
- Metrics may overlap within different metric sets.
The list of available metrics depends on the hardware you use.
Select the active metric set by using the Active Metric Set drop-down menu in the GPU section of the metric tree.

Configure the HUD metrics
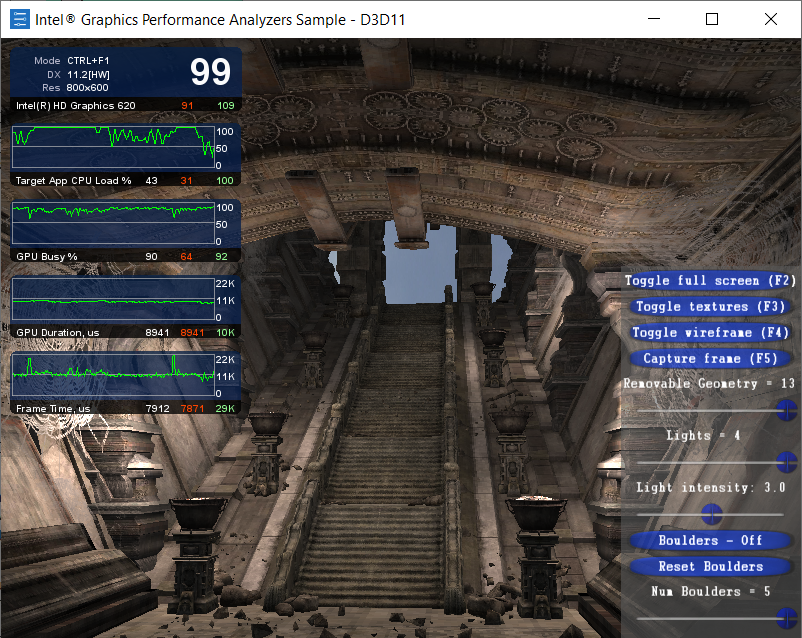
Heads-Up Display (HUD) is an overlay provided at the top left of the screen when you launch an application for analysis. The HUD displays system and application statistics on application performance using the GPU and CPU performance metrics of your choice.
The HUD enables you to see the metrics in real time, make first assumptions, and detect potential bottlenecks for further detailed analysis with Trace or Frame Analyzer. You can select up to four metrics that are overlaid on your running application. For the first time, you can choose basic metrics such as Target App CPU Load, GPU Busy, GPU Duration, Frame Time.

A basic scenario is to run the application with the HUD overlay, analyze the FPS rate, find a problematic scene, and capture a trace to find out whether your application is CPU- or GPU-bound. In some cases, you can determine whether your application is CPU- or GPU-bound immediately. For example, if the HUD displays that the CPU load is 100% while the GPU is only 30% utilized, your app is CPU-bound.
Configure HUD metrics the following way:
Select a metric from the list of available metrics. Drag and drop a desired metric to the Active HUD Metrics list at the bottom of the Metrics tab.
Reorder the Active HUD Metrics list by dragging and dropping a desired metric over another active metric.
Remove a metric from the Active HUD Metrics list by dragging and dropping the metric back to the list of available HUD metrics. Or by hovering over the metric and clicking the X button.
Change a D3D Device for the Instrumented Process (Windows* only)
If your graphics application works with multiple D3D devices, you can choose the D3D device for the instrumented process to collect metrics and show the HUD.
For example, you can change a D3D device of the instrumented process for Mozilla* Firefox*, if the System Analyzer HUD is displayed on the title bar instead of the tab of interest.
Launch your application that works with multiple D3D devices, as described in Analyze GPU-bound Applications with Graphics Frame Analyzer.
Enable the HUD Display Mode by using the Ctrl+F1 keyboard shortcut.
Change D3D devices by using the Ctrl+F5 keyboard shortcut.
See Also
Identify GPU-CPU issues with Graphics Trace Analyzer
Heads-Up Display (HUD) UI Reference