Visible to Intel only — GUID: GUID-8ADA0773-EAE1-41FA-89C6-CF6A4E852CCC
Visible to Intel only — GUID: GUID-8ADA0773-EAE1-41FA-89C6-CF6A4E852CCC
Manage Analysis with Graphics Monitor
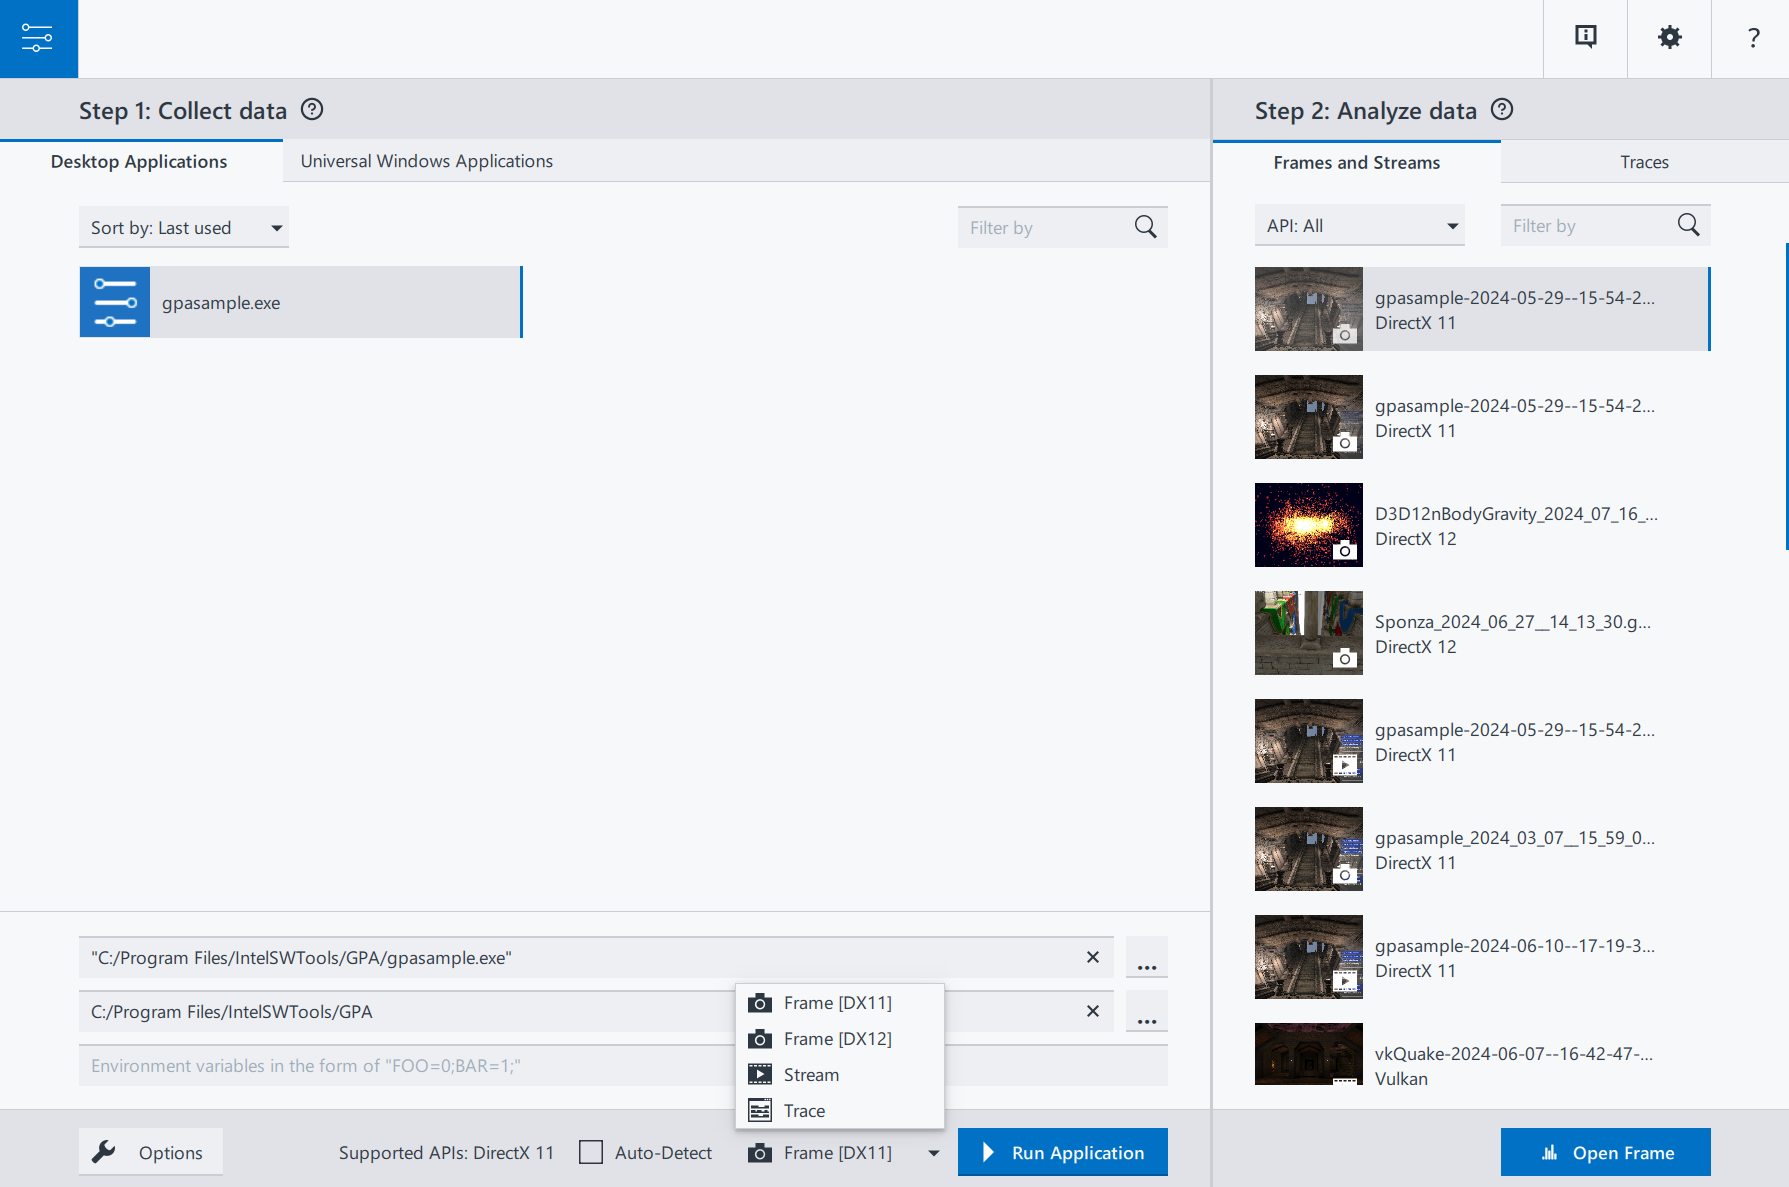
Graphics Monitor is the hub tool of the Intel® GPA suite. It enables you to configure analysis settings, capture frames, streams and traces and open them using the respective tools.
You can use Graphics Monitor to launch applications for analysis and manage different aspects of profiling.

Manage Analysis Options
Before you begin your analysis, it is recommended to configure your analysis options using the Options window to align the tool behavior with your needs.
See the Configure Analysis Settings section for details.
Launch Applications for Analysis
To launch your applications for analysis using Graphics Monitor:
Select an application for analysis.
Select the application startup mode from the Application Startup Mode drop-down menu at the bottom. Select the mode that corresponds to the type of performance data you want to capture.
Press Run Application to run the application.
Your application starts with the Heads-Up Display (HUD) enabled. HUD is an overlay provided at the top left of the screen when you launch the application. HUD displays system and application statistics on application performance using the GPU and CPU performance metrics.
See the Launch Application for Analysis section for details.
Next Steps
Once you launch your application, use the HUD to track performance in real-time. Capture a frame, trace, or a stream to investigate the performance issue deeper using other tools of the Intel® GPA toolset.