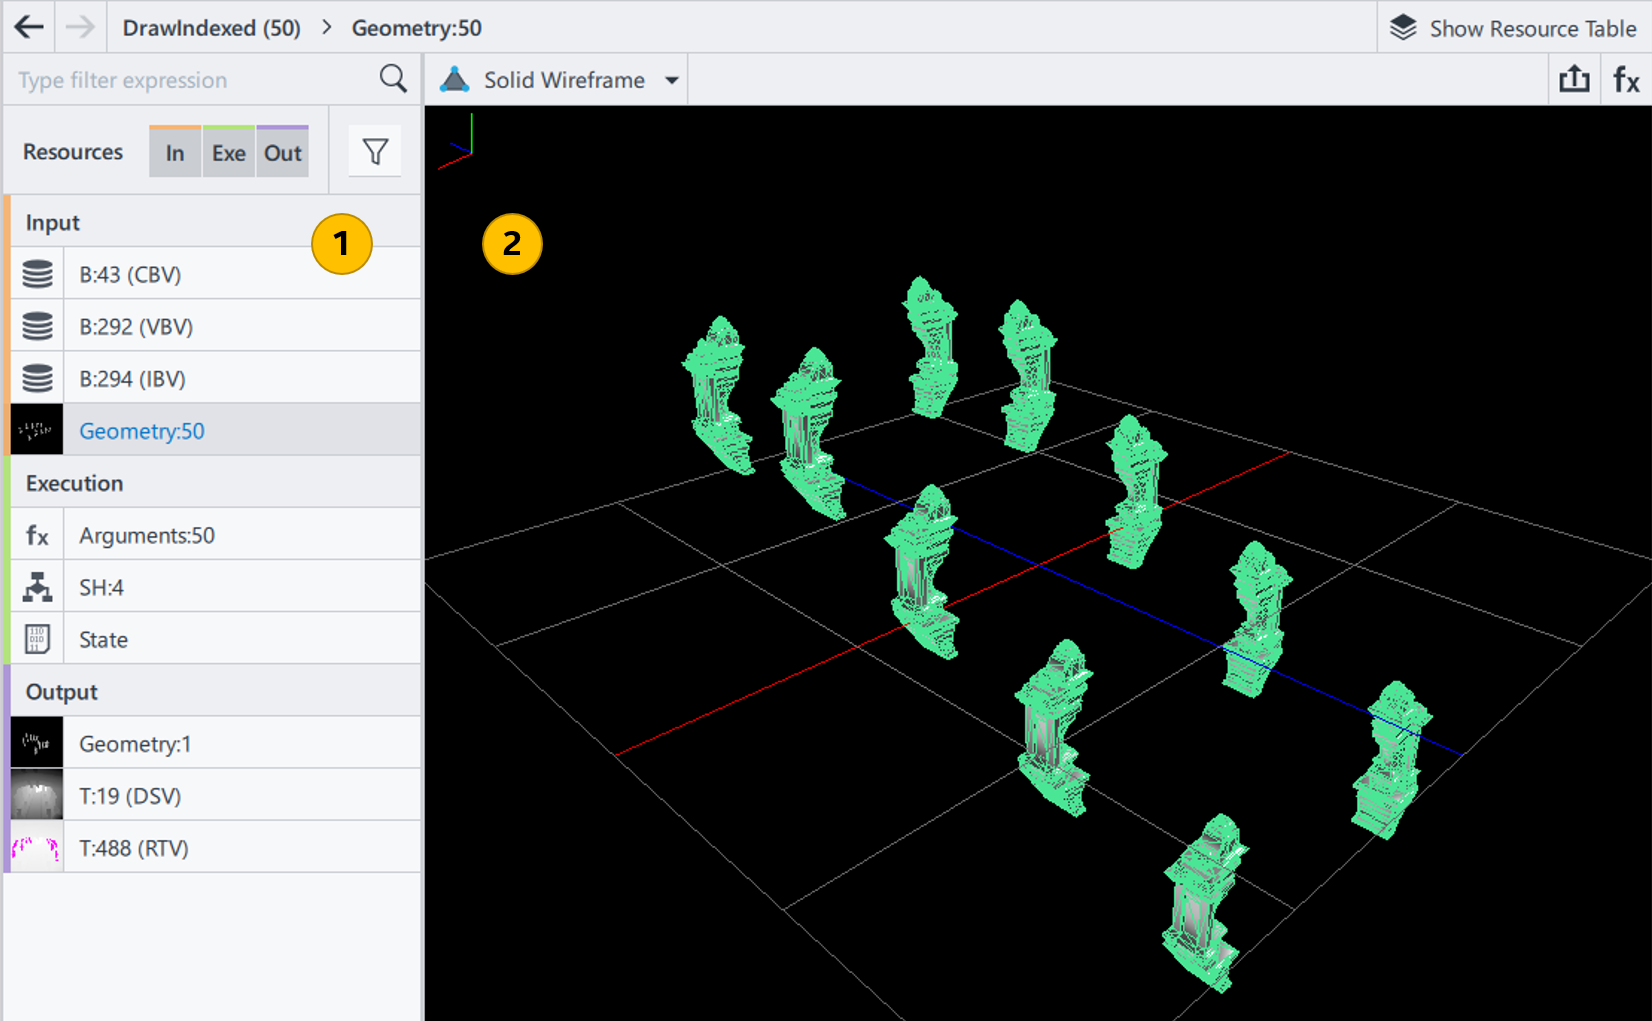
Resources Pane
|
Resource List Displays all resources used by the selected graphics API functions. |
|
Resource Viewer Displays details about the resource selected in Resource List. |
Resource List
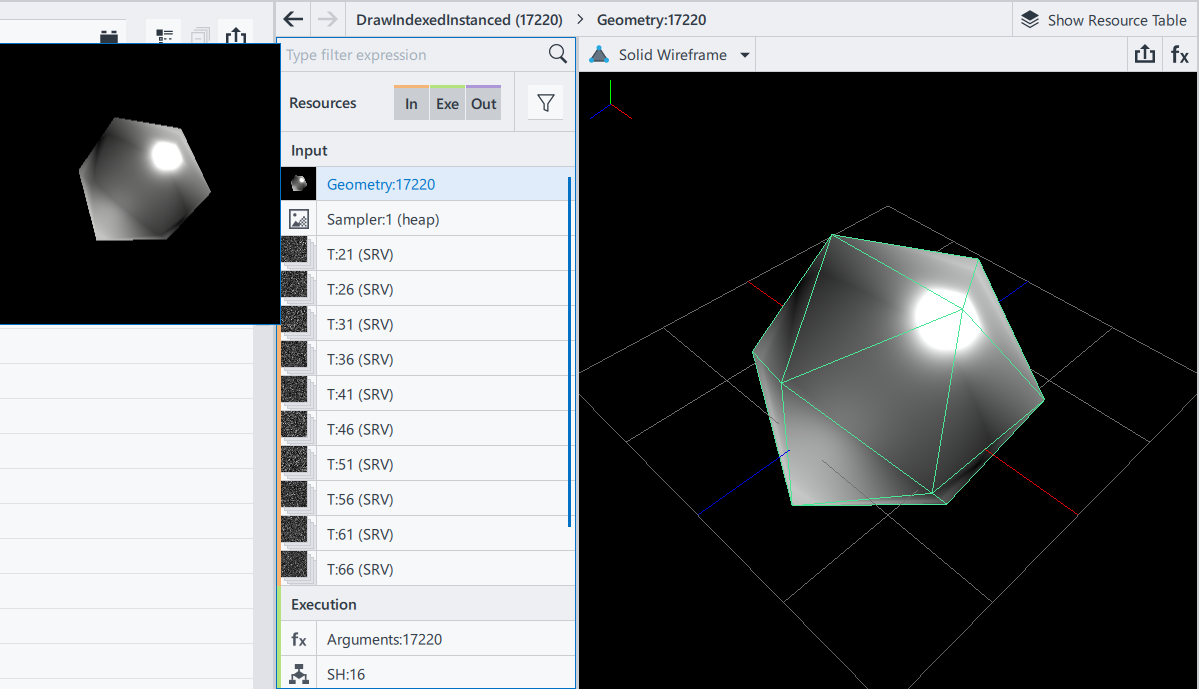
All resources are grouped by Input, Execution, and Output stages.
By default, Frame Analyzer shows all resources attributed to the current selection. Use the ![]() Filter menu to filter resources by type:
Filter menu to filter resources by type:
Geometry
Textures
Shaders
Data buffers
Graphics/Compute Pipeline States
Samplers
API call arguments
To filter resources by name, type the desired name or parameter into the Type filter expression field.
Some resources support previews. To see the preview, hover over the resource thumbnail in the Resource List.
Use ![]() Back and
Back and ![]() Next buttons to navigate back and forth between recently selected resources and events.
Next buttons to navigate back and forth between recently selected resources and events.
For textures, shaders, or geometry, you can choose the following view types:
Table View
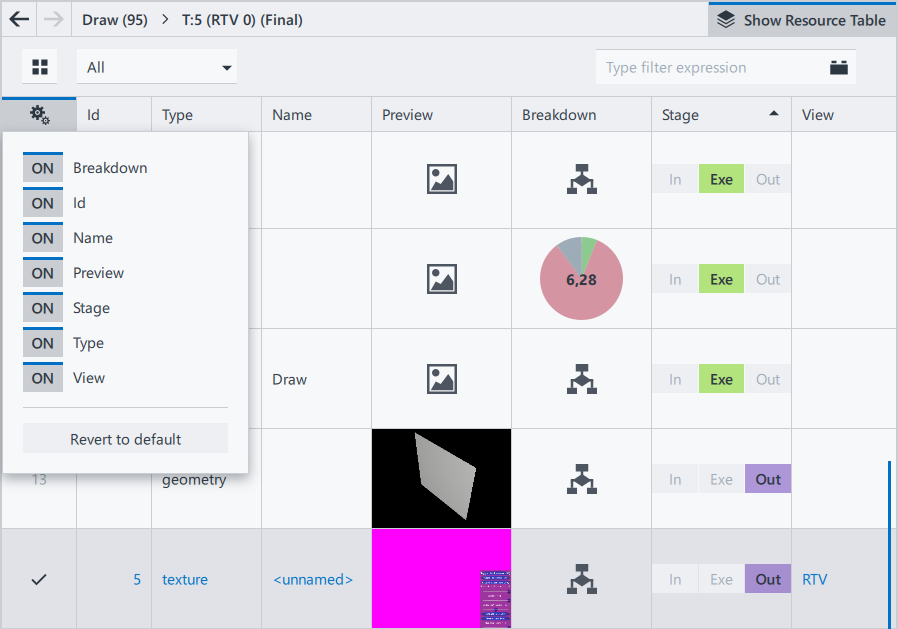
To see resources in a tabular view, click the
 Show Resource Table button.
To configure table columns, click the
 button.
To select a resource and open it in the Resource Viewer, click the row with the required resource.
Tile View
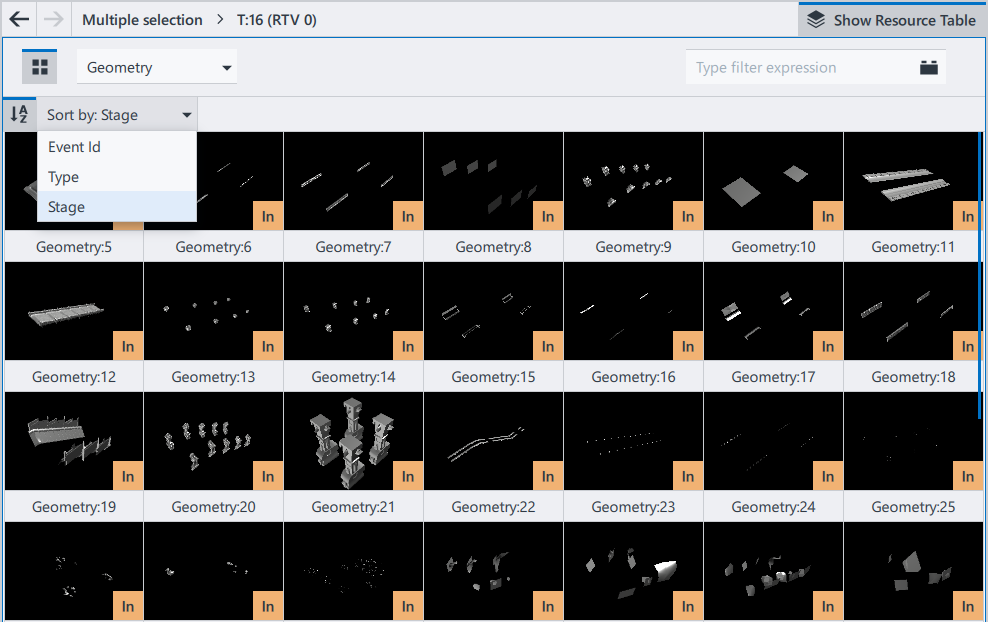
Tile view shows only resource thumbnails. To open tile view, click the
 button. Resources can be sorted by resource type, name, ID, or stage.
To select a resource and open it in the Resource Viewer, click the row with the required resource.
Resource Notations
Resource names, except texture and buffer names, are abbreviated and shown in the Resource List and Resource Viewer in the following format:
<resource type>:<resource ID> [<user-defined name>]
Texture names and buffer names are shown in the following format:
<resource type>:<resource ID> (<view type><view ID>)
Resources Names for DirectX API
Name Component |
Description |
|---|---|
<resource type> |
Can be B (buffer) or T (texture). |
<resource ID> |
Any positive integer. 0 is an exception used to identify a synthetic DirectX 12 root constant resource. |
<view type> |
Depends on the resource type. |
|
|
<view ID> |
Any non-negative integer number. Continuous numbering is used, that is a view ID value does not depend on a view type. |
Resource Viewer
Resource Viewer displays details of the resource selected in Resource List. Resource Viewer layout depends on the resource type.
Resource Viewer: Geometry
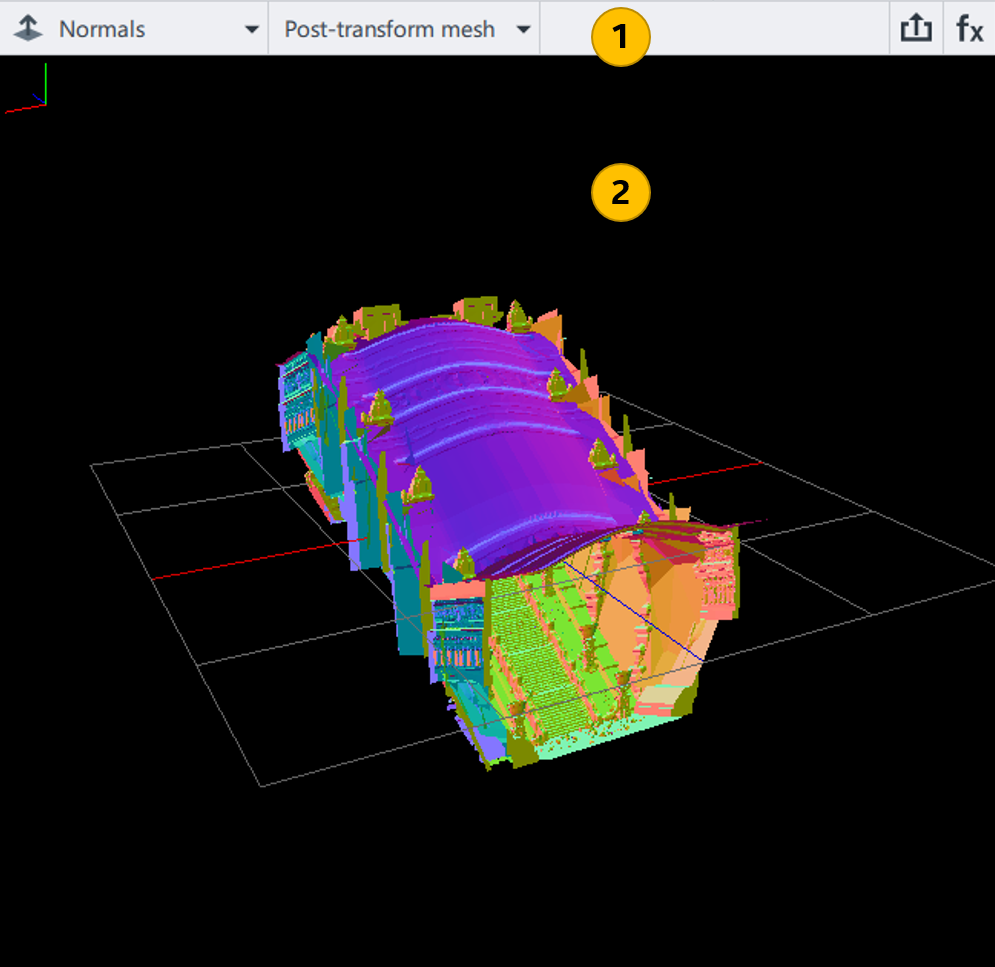
|
Geometry Viewer panel Visualization Mode drop-down list - switches between view modes to analyze various geometry aspects of the selected geometry object. There are the following visualization modes available:
|
|
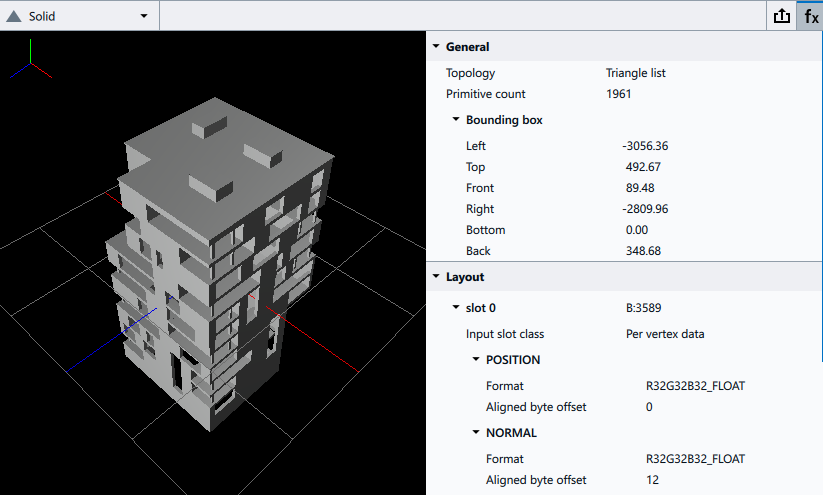
Geometry Viewer window Shows a mesh for the selected call. If geometry input cannot be extracted, the viewer will display a notice instead of the mesh.
NOTE:
For DirectX 11 and 12, output geometry can be selected for several calls within one render target region.
|
You can rotate the object in any direction by clicking and holding the mouse pointer. To invert normals by 180 degrees, right-click the geometry object. To flip vertical and horizontal planes, middle-click the geometry object.
Resource Viewer: Texture
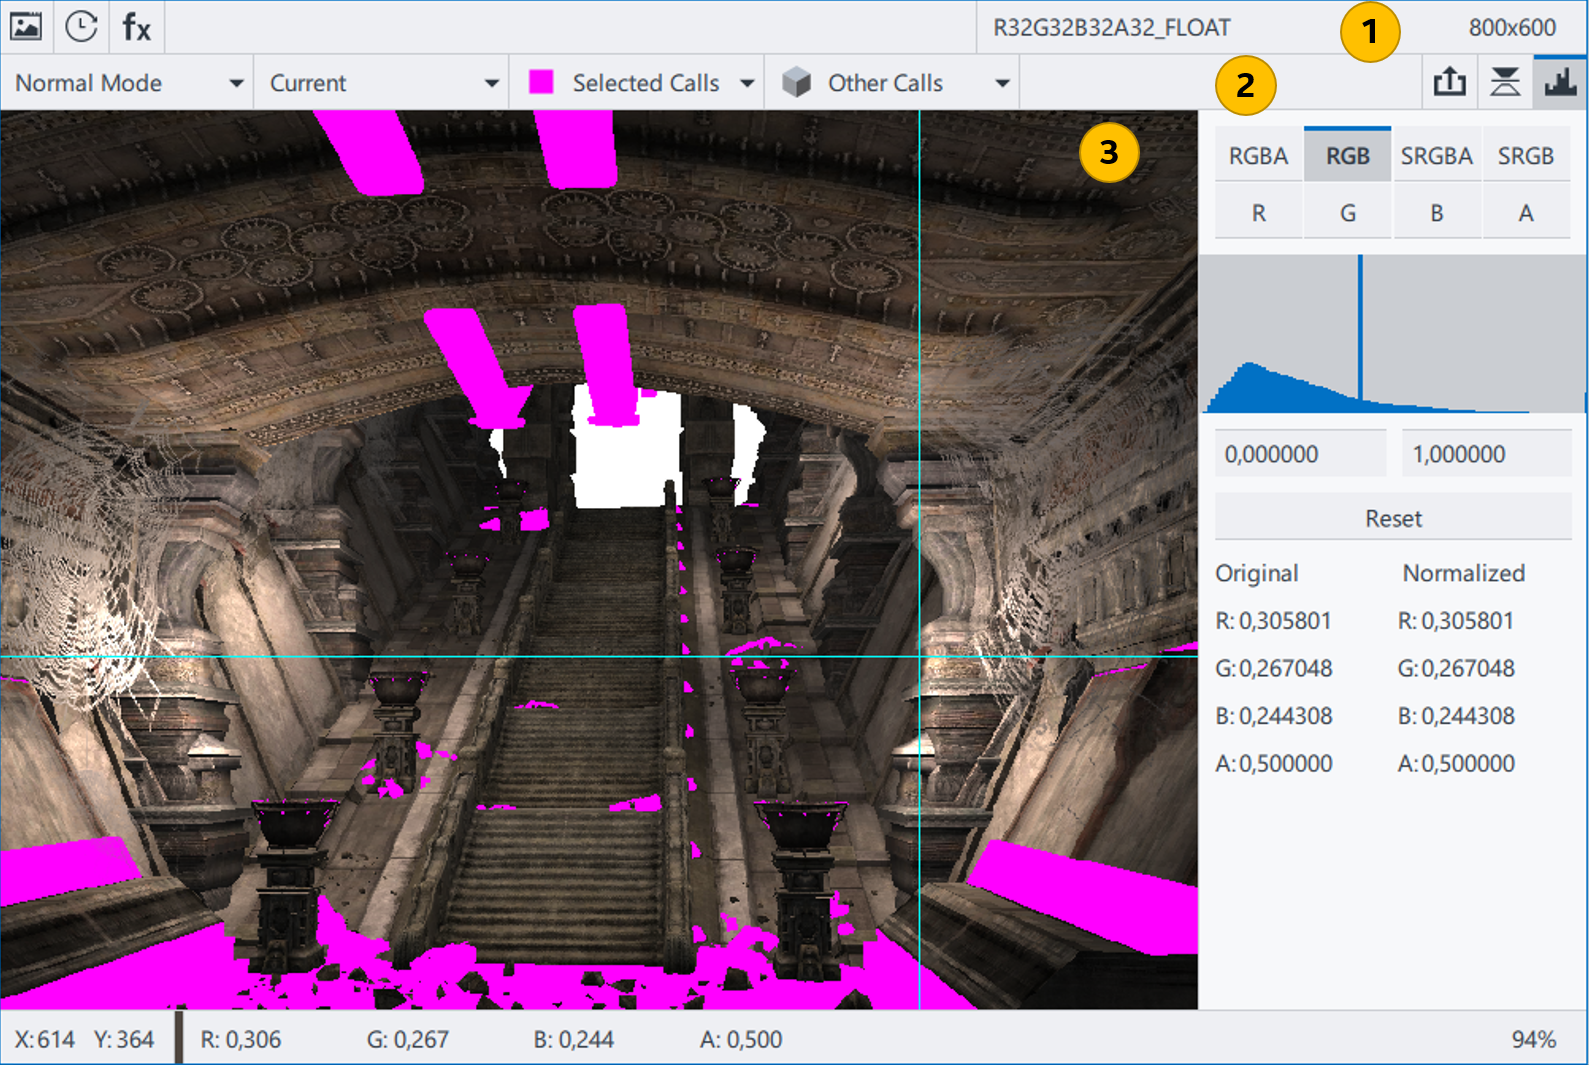
|
Texture Viewer pane
Texture Info field - shows the resource type and internal ID; view type and ID; and debug name, if available. Format field - shows the original texture format. Dimensions field - shows the resource dimensions, such as width, height, depth - or layer count and sample count for multi-sample textures. |
|
Texture Viewer toolbar
NOTE:
Selected Calls and Other Calls viewing options apply only to the draw calls that render into the selected render target.
|
|
Texture Viewer window Shows a texture image or render target. |
For textures with mipmaps, 3D textures, and texture arrays, you can select a particular subresource in the ![]() MIP-level selector or the
MIP-level selector or the ![]() Layer selector:
Layer selector:
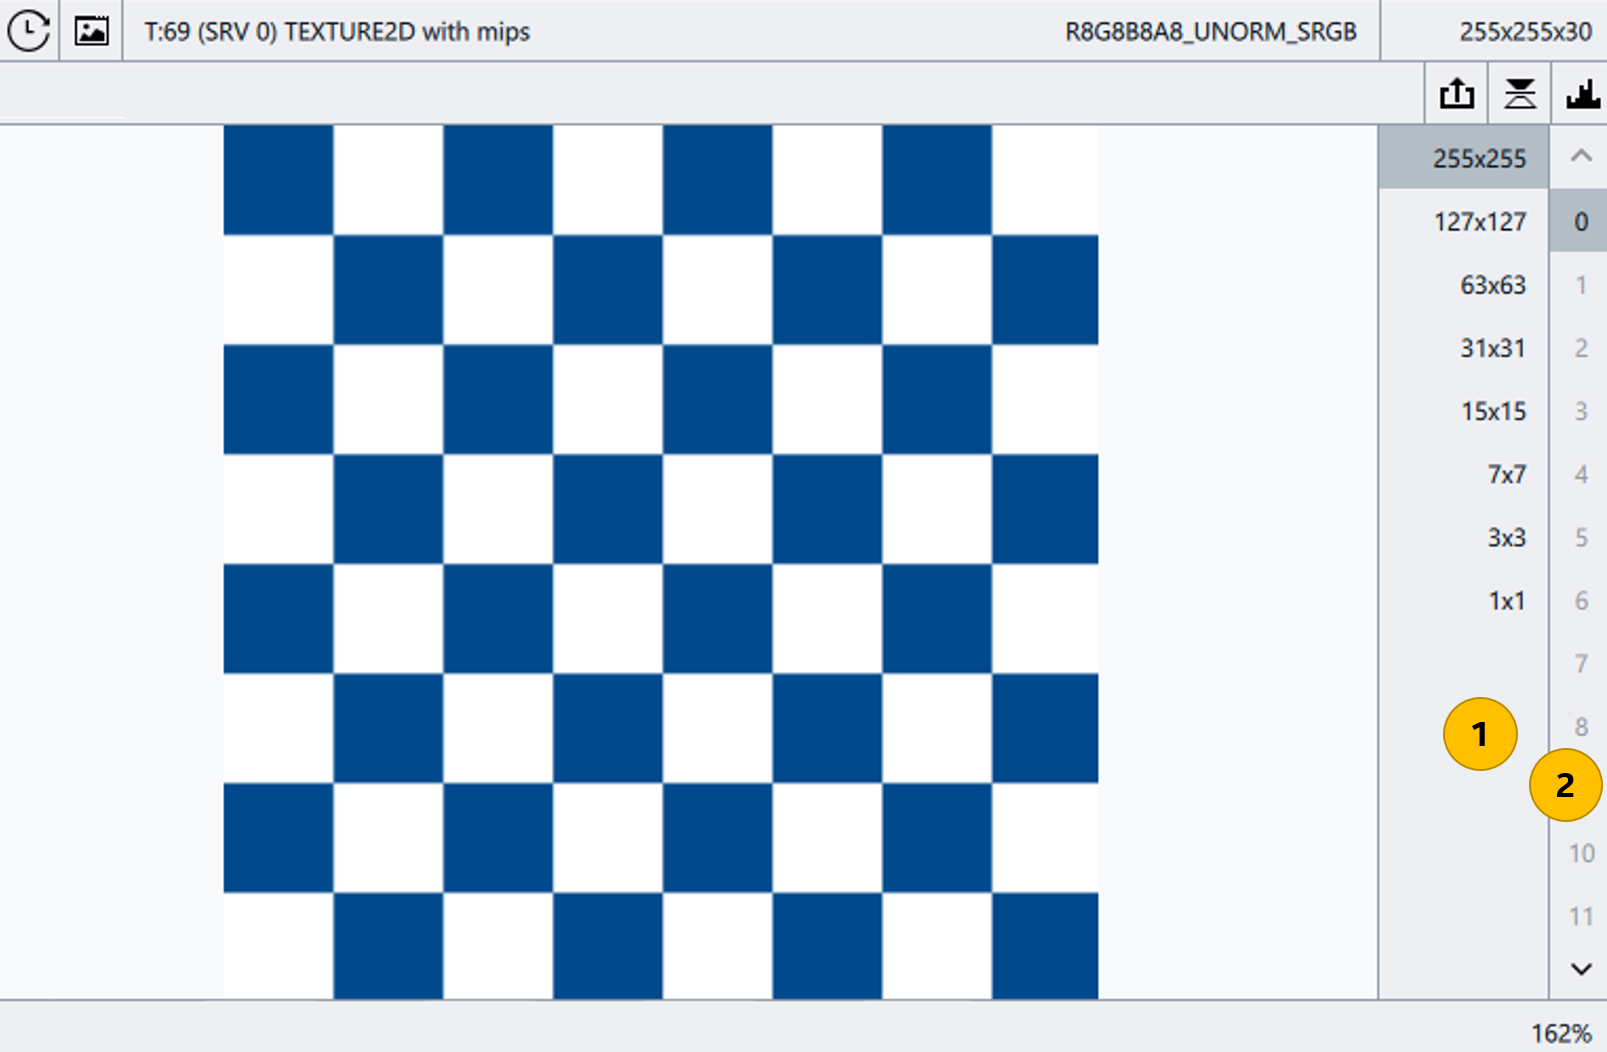
Grayed-out values in the MIP-level selector or in the Layer selector mean that the corresponding subresources are not defined in the selected resource view.
You can experiment with SRV textures using the following elements:
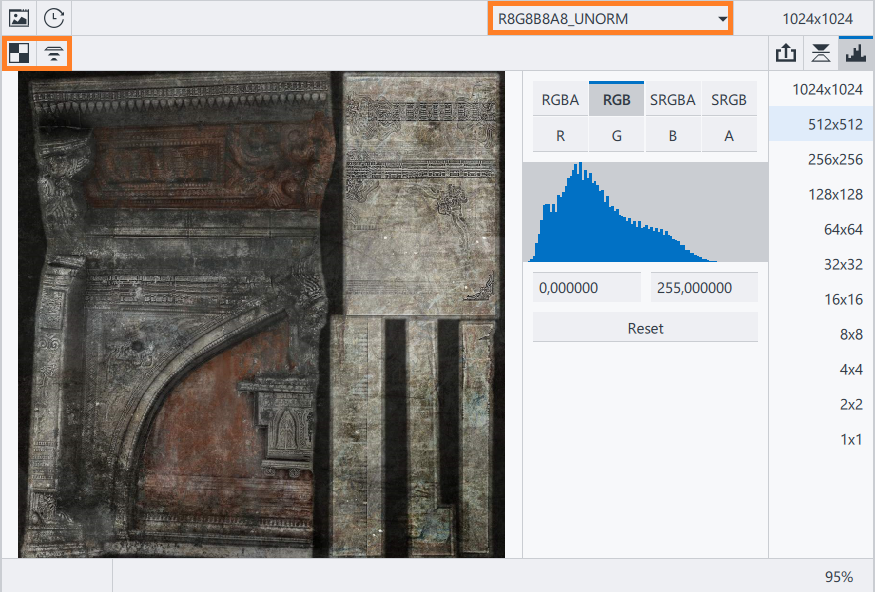
 Texture 2x2 button - replaces the opened texture with a simple 2x2 pixel texture for the selected events. The experiment creates a new texture with the same name and of the same type, and denoted as [modified].
 Clamp to Selected MIP Level button - disables all mipmaps of the opened textures that are greater than the current mipmap level of the texture for the selected events. The experiment creates a new texture with the same name and of the same type, and denoted as [modified].
Format drop-down list - shows the original texture format and enables texture format replacement (DirectX 11 only).
To disable the applied experiments, click the  button on the texture thumbnail in Resource List.
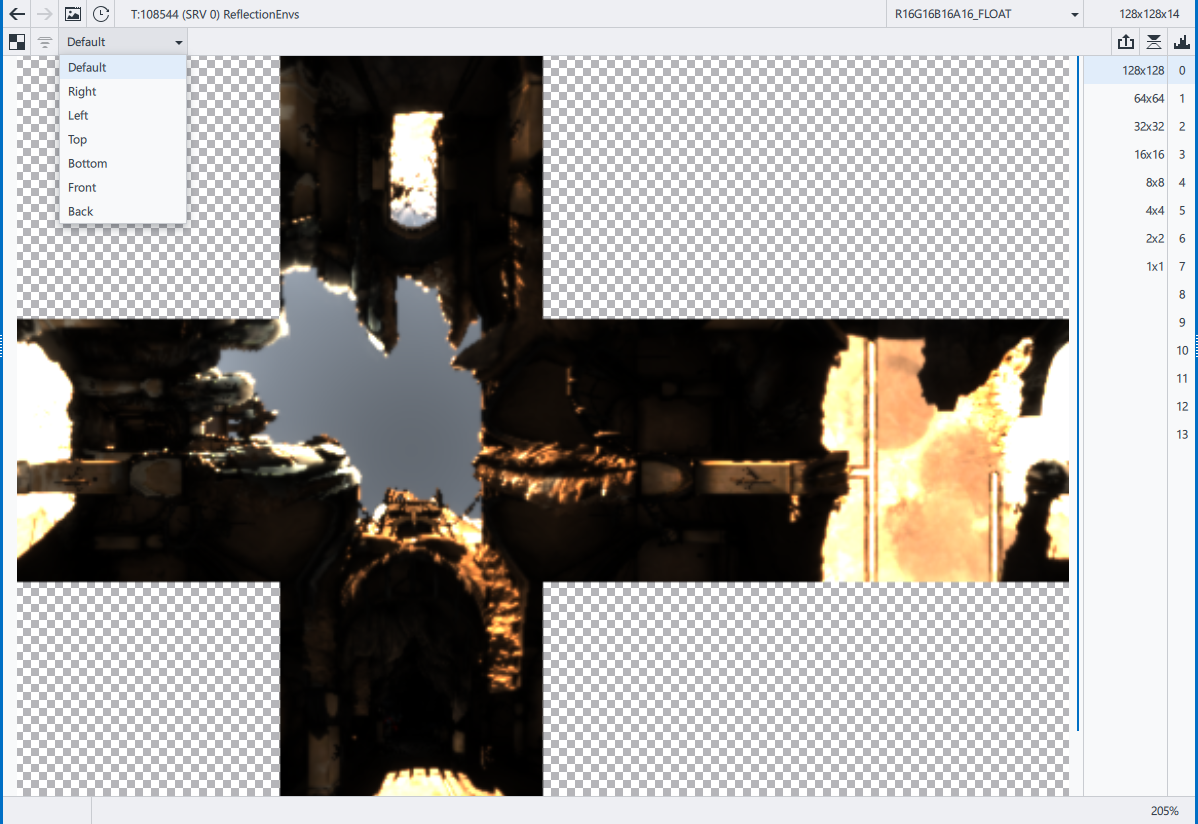
For cube map textures, you can open one face of a cube map by selecting the desired face from the drop-down list. The Default option is a cube map layout.
Resource Viewer: Shader
|
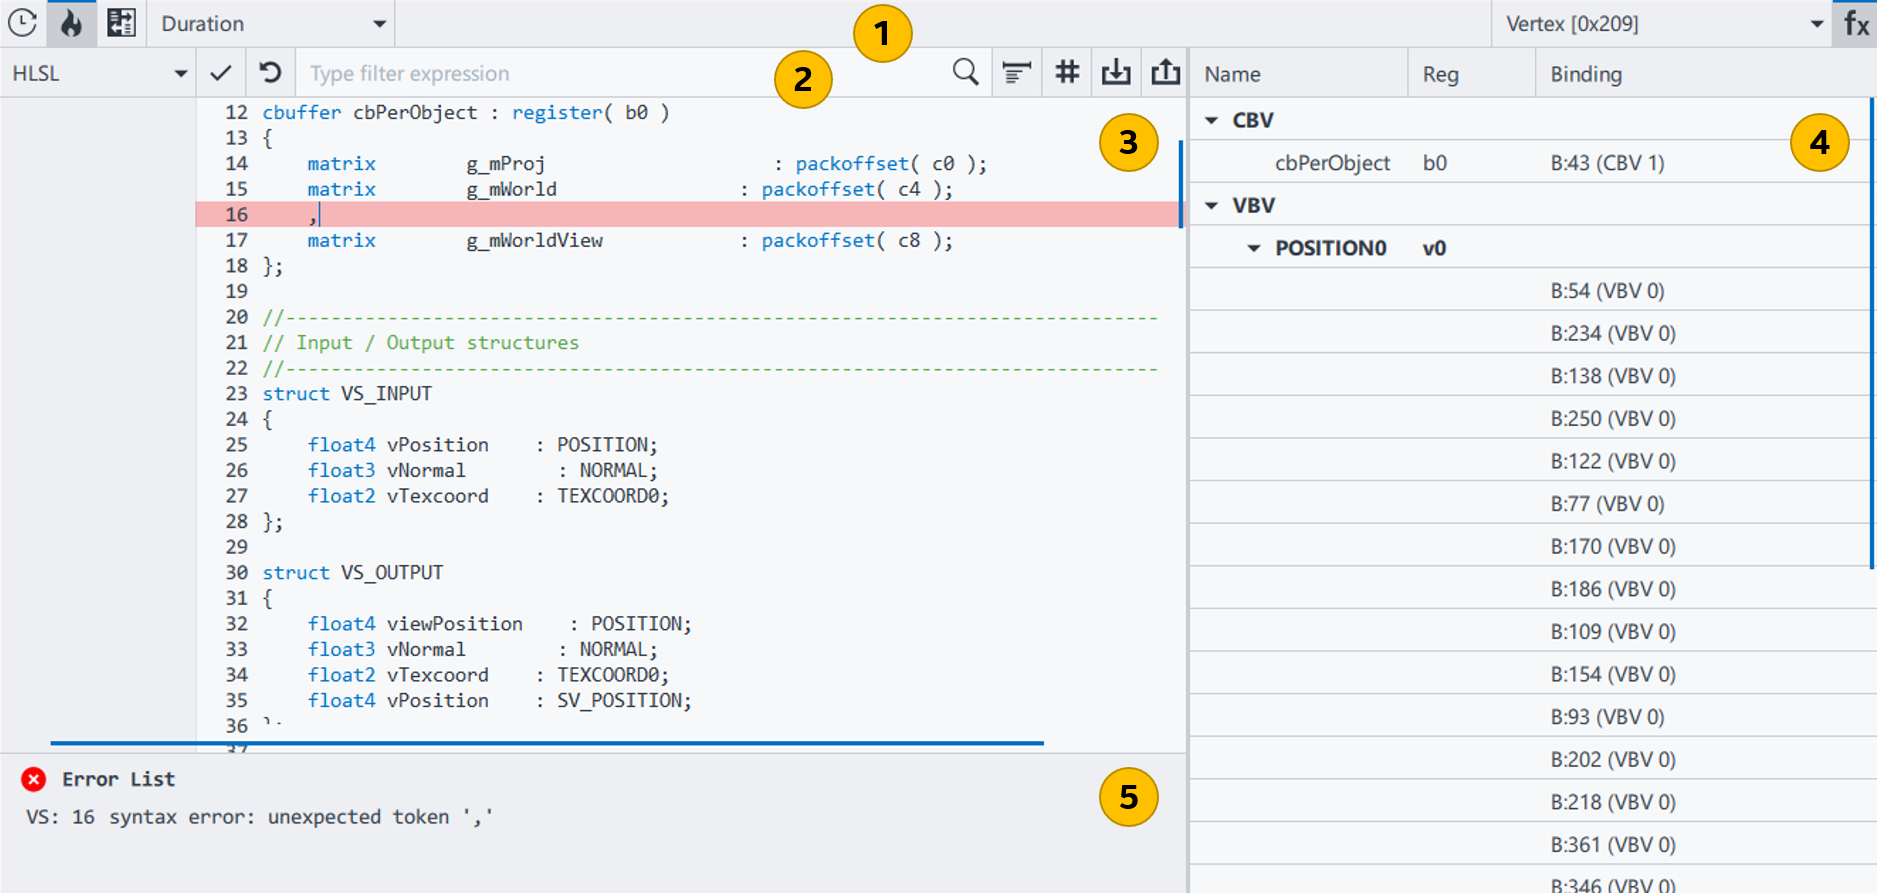
Shader Viewer pane
Shader Type drop-down list - shows the type of the opened shader. |
|
Shader Viewer toolbar
For DirectX frames, you can choose Compiler Flags from the Shader Code list to see what options are used to compile the source code.
Type Filter Expression field - filters shader code values.
|
|
Shader Editor Enables you to view a shader code, change it and apply changes to the selected draw calls or dispatch calls. |
|
Shader Resource List Lists bound resources and constants used in the opened shader. |
|
Notification pane Displays errors and warnings that relate to the selected shader code. |
Resource Viewer: Shader Table
Shader Table is a tool for deep analysis of ray tracing shaders. The table visualizes all shaders that can be potentially executed as a result of a DispatchRays call. Shader Table also contains performance metrics for each shader.

When you select a DispatchRays call in Graphics Frame Analyzer, Shader Table becomes available in the Resource List as a separate item. Click the Shader Table resource to view detailed information about shaders:
Export Name(s) - unique shader names, which are exported from the raytracing pipeline state object and used to generate the shader identifier.
DXIL Entrypoint - shader name from the HLSL source code.
Hit Group(s) - names of hit groups where the shader is used. Only closest hit,any hit, and intersection shaders can be included in a hit group. Cells in the Hit Group(s) column are always empty for ray generation,miss, and callable shaders.
HW Thread Count - number of hardware threads executing instances of a shader. If the number is zero, the shader was bound to the pipeline but not executed. Maximum number of shader instances in a hardware thread depends on SIMD width (8, 16, or 32).
Duration % - relative duration of a shader, where 100% is the sum of durations for all shaders.
SIMD Occupancy % - number of SIMD lanes executing a shader, in relation to the total number available across all threads. If SIMD occupancy is low, the hardware scheduler could not aggregate different shader instances in one thread. Developer and Optimization Guide describes how to improve SIMD occupancy.
SIMD Active Channels - the number of rays processed by the shader. The value of SIMD Active Channels metric equals to HW Thread Count * SIMD width * SIMD occupancy / 100%.
Type - shader type as defined in the DXIL library.
DXIL Library - identifier of the DXIL library where a shader is declared. You can use the identifier to find a proper shader code from the Resource List.
Resource Viewer: Buffer
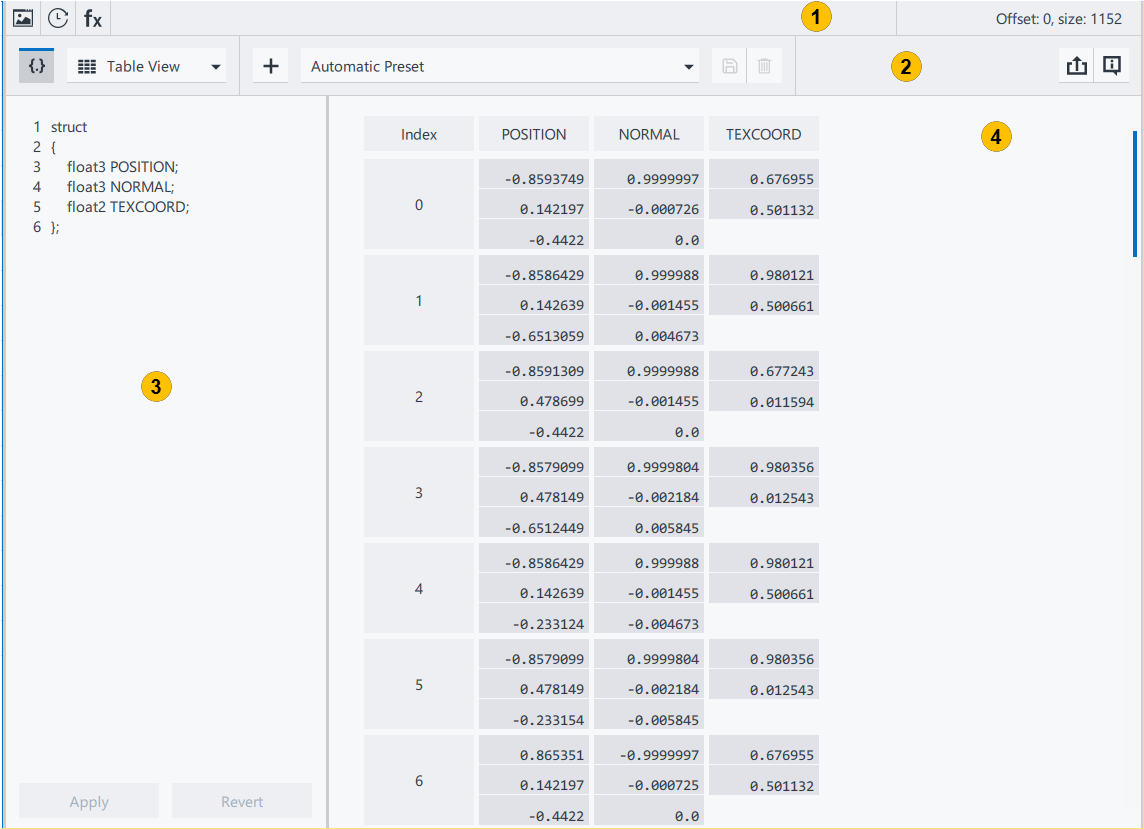
|
Buffer Viewer pane
Offset and Size field - shows the offset value and size of the opened buffer block in the original buffer object. |
|
Buffer Viewer toolbar
|
|
Layout Editor - Use the Layout Editor to see and edit an open buffer layout, and spot errors. The layout is written in the buffer markup language.
|
|
Buffer Viewer window - Show details about the open buffer in a table or list. |
Resource Viewer: Graphics/Compute Pipeline State
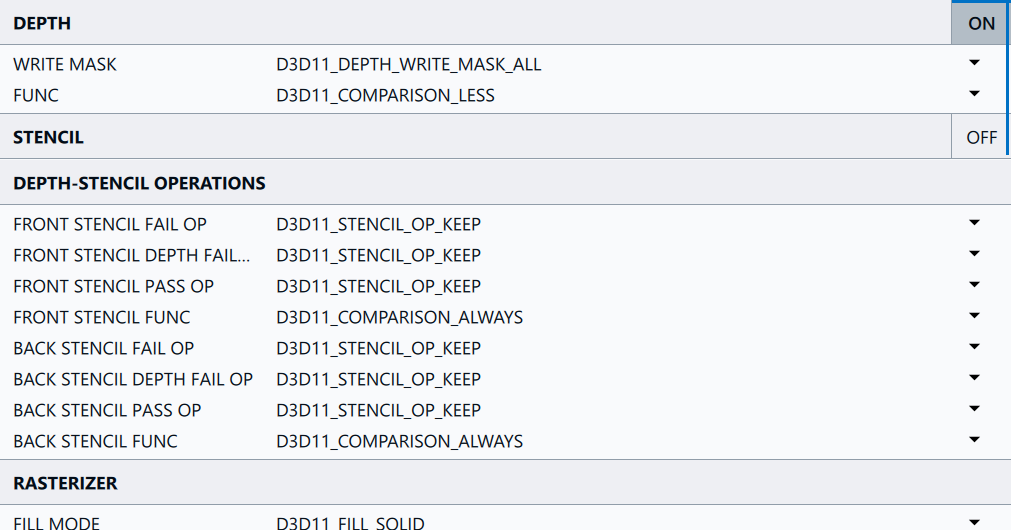
The Graphics/Compute Pipeline State Viewer shows settings for fixed function blocks of the graphics/compute pipeline. The settings can be changed.
For DirectX and OpenGL applications, State Viewer shows API-agnostic data. The data can be modified for several draw calls simultaneously:
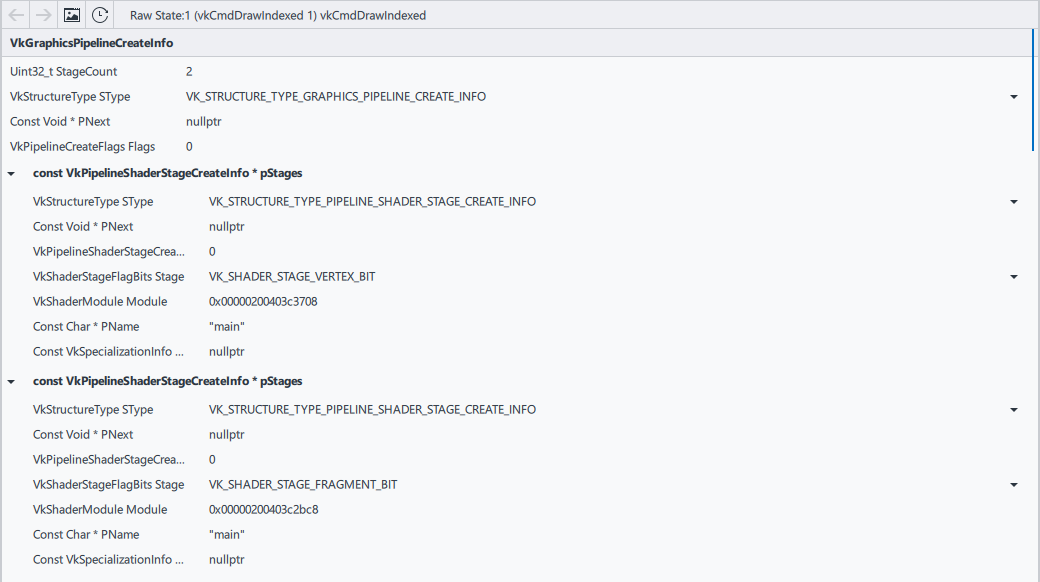
For Vulkan, State Viewer shows Vulkan-specific data only for one draw call:
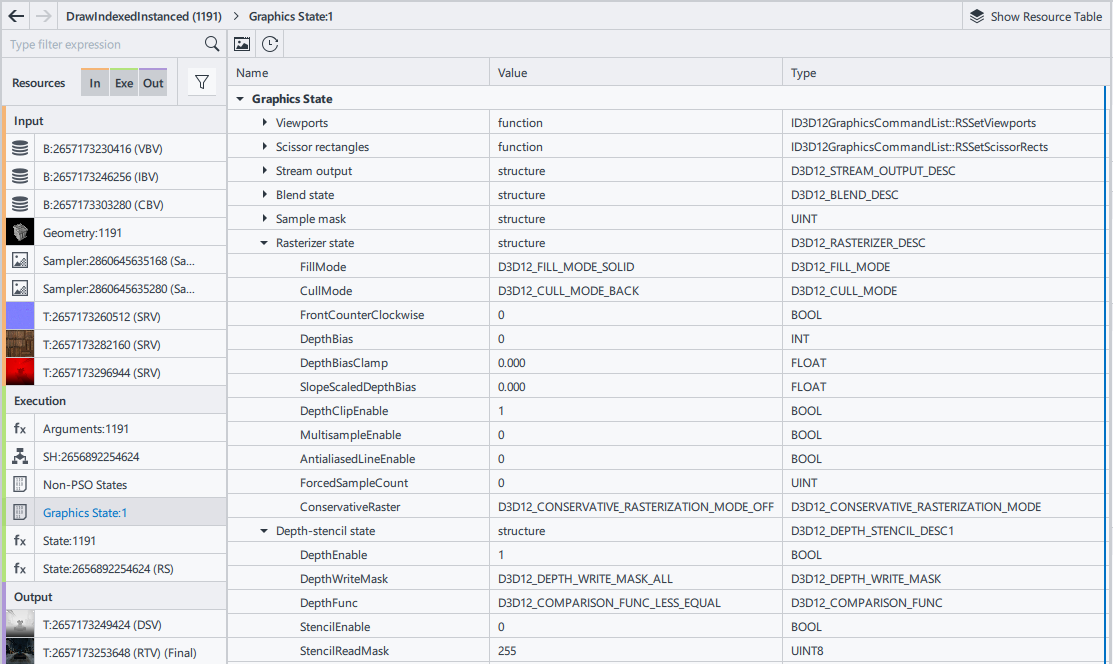
The Graphics State is a read-only combined state view that unifies both Pipeline State Object (PSO) and non-PSO states (supported modes: Frame [DX12], Stream). When multiple calls are selected in the API Log, this view provides information about all selected calls.
The Graphics Pipeline State is an editable layout pane that enables changing the pipeline state (supported modes: Frame [DX12], Stream DX12). To edit states, select draw or dispatch calls in the API Log. Note that Compute Pipeline State is shown for dispatch calls, and Pipeline State Stream is shown for DispatchMesh calls. If multiple calls are selected, the updated property is applied for all selected calls having the same pipeline state.
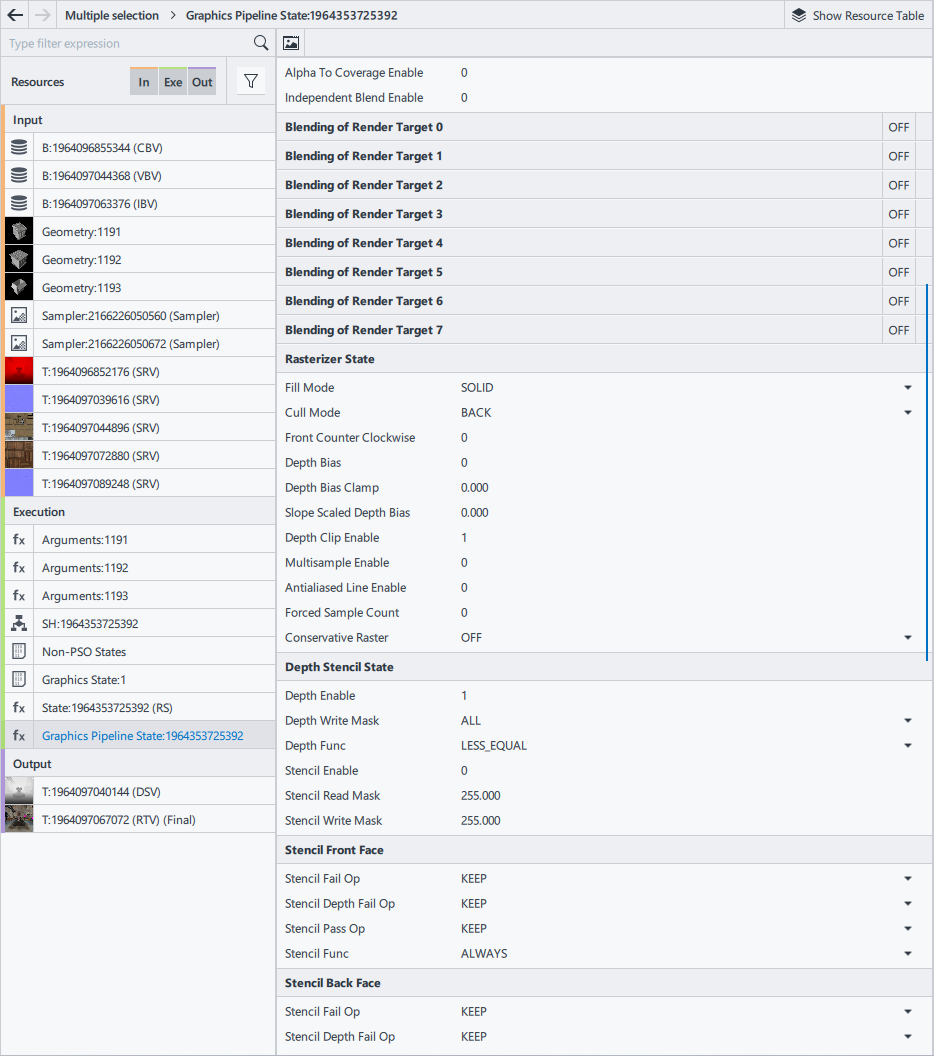
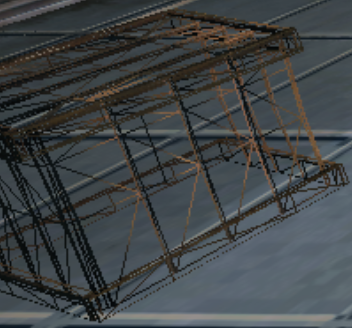
For example, you can change Fill Mode to Wireframe. The changes are applied immediately. You are able to see the results on RTV (as shown below).
Resource Viewer: Non-PSO States
The Non-PSO States is an editable pane that is available for DirectX 12 in the Frame [DX12] and Stream modes. This pane exposes states that can be set on a command list by using graphics API functions: RSSetViewports, RSSetScissorRects, RSSetShadingRate, and OMSetBlendFactor. You can view and edit the Non-Pipeline State Object (PSO) states if you select draw calls or DispatchMesh calls in the API Log.
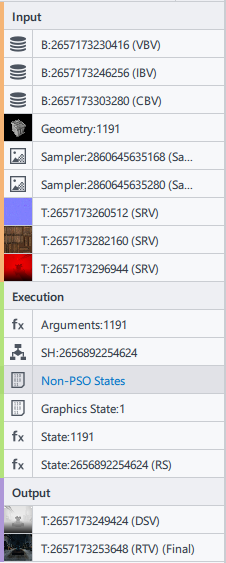
The pane shows Shading Rate, Blend Factor, Viewports, and Scissor Rects. You can select multiple draw calls and edit non-PSO states for all of them at the same time.
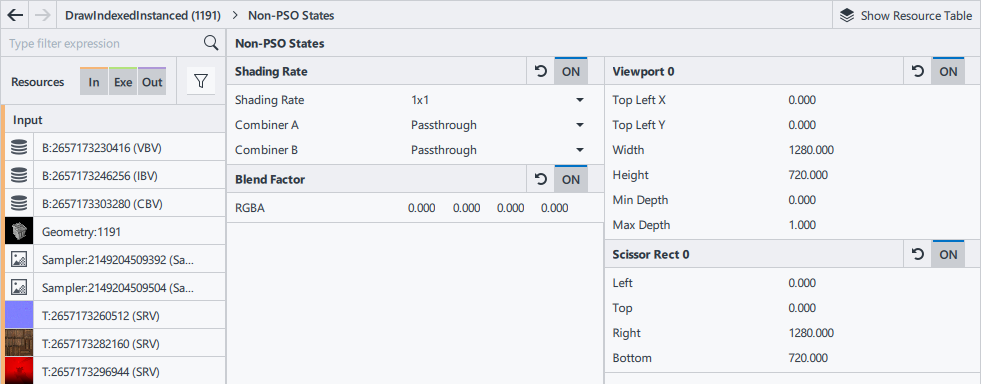
Setting the viewport changes it for selected draw calls. To get more information about structure fields, visit the page D3D12_VIEWPORT structure.
Setting the scissor rectangle changes it for selected draw calls. To get more information about structure fields, visit the page D3D12_RECT structure.
Setting the blend factor changes it for selected draw calls if corresponding pipeline states use the blend state with D3D12_BLEND_BLEND_FACTOR. To get more information, visit the page ID3D12GraphicsCommandList::OMSetBlendFactor method.
- Setting the shading rate reduces the shading quality for selected draw calls. Supported shading rates include
-
1x1
1x2
2x1
2x2
2x4
4x2
4x4
- Supported shading rate combiners include:
-
Passthrough
Override
Min
Max
Sum
No VRS |
4x4 VRS applied |
|---|---|
No variable-rate shading applied, which is the same as a 1x1 shading rate. |
For 4x4 VRS, one pixel is rendered for each 4x4 group of pixels. |
|
|
Resource Viewer: Samplers
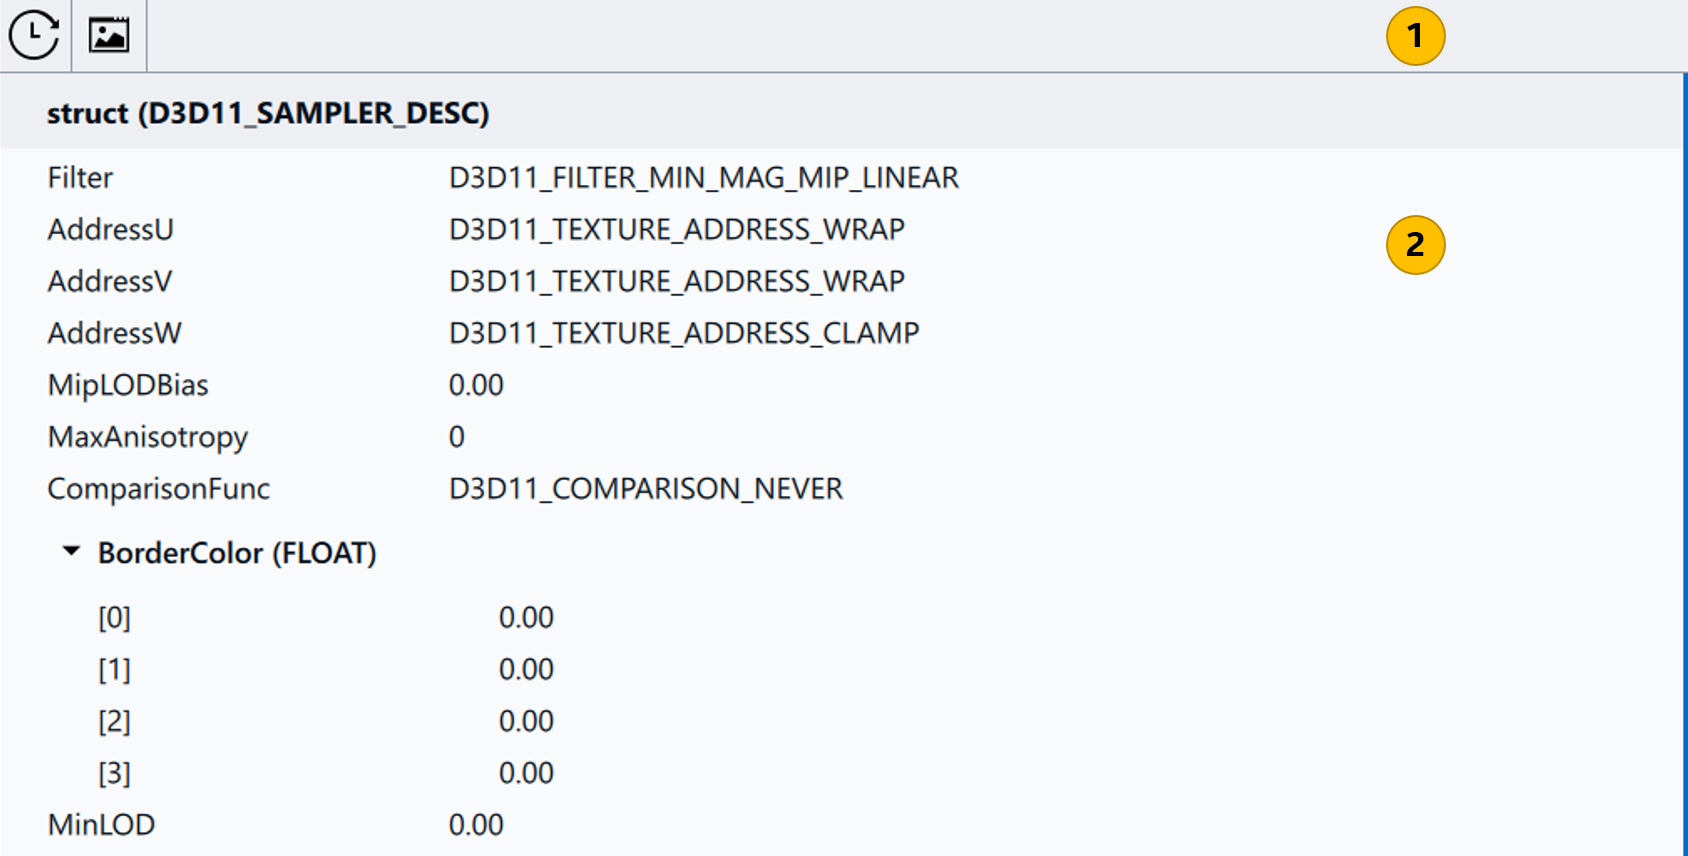
|
Sampler Viewer pane
|
|
Sampler Viewer window Shows read-only settings for sampling textures. |
Resource Viewer: API Call Arguments
The API Call Arguments Viewer lists arguments of the selected graphics API function. The viewer shows data only for a single function.
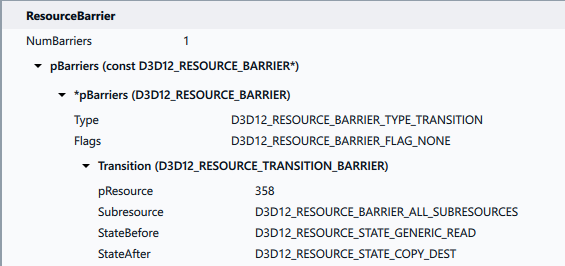
For the DirectX 11 and DirectX 12 frames, you can change arguments to change input geometry, clear color or the number of computing threads.
You can change arguments for the following calls:
ClearRenderTargetView
ClearDepthStencilView
ClearUnorderedAccessViewFloat
Dispatch calls
For DirectX 11, all draw calls except DrawIndexedInstancedIndirect and DrawInstancedIndirect
For DirectX 12, DrawIndexedInstanced and DrawInstanced
Resource Viewer: Root Signatures and Descriptors (DirectX 12 and Vulkan only)
This resource view enables you to explore the internals of DirectX 12 Root Signatures and Vulkan Descriptor Sets. This can be useful for debugging sporadic rendering issues, like a wrong texture being used for an object.

 Solid (default) - view the object as a solid model.
 Wireframe - view a wireframe model to inspect the backside of the object and to understand how it is built from triangles.
  Solid Wireframe - view a wireframe model on top of the solid model.
 Normals - view a normal map for your object to analyze how the normal vectors are plotted.
 Save Geometry to File button exports geometry data in the Wavefront OBJ format.
 Geometry Layout button (specific for DirectX 11, DirectX 12, and Vulcan) displays geometry details. The Geometry Layout pane contains general information, such as topology and bounding box, as well as the attached vertex buffers and their layout:
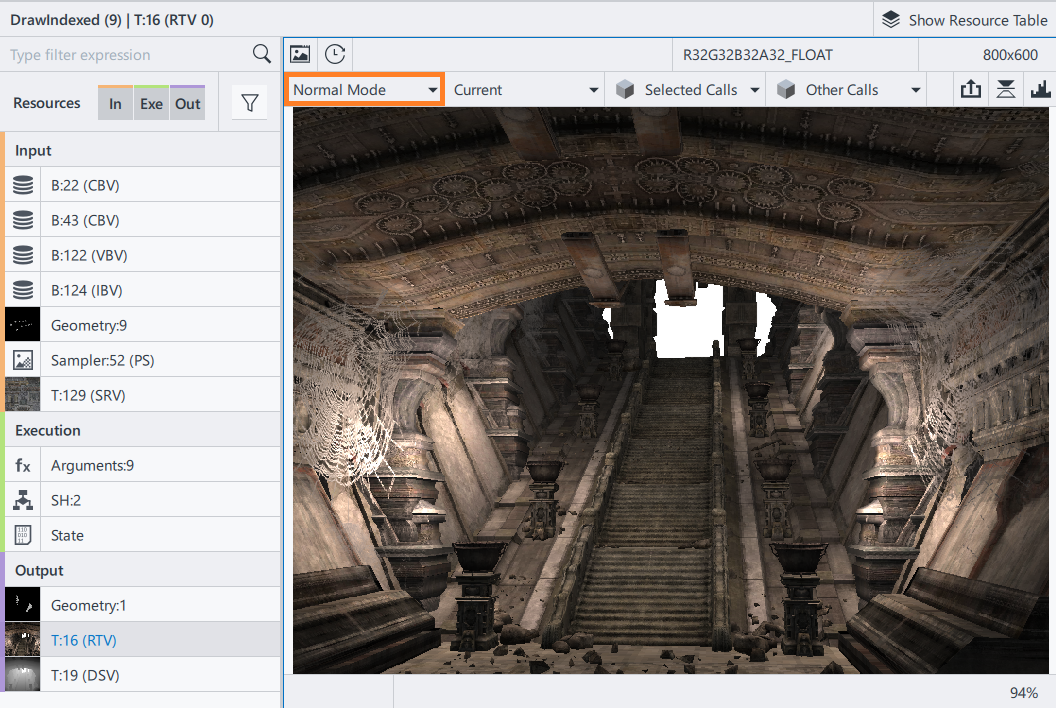
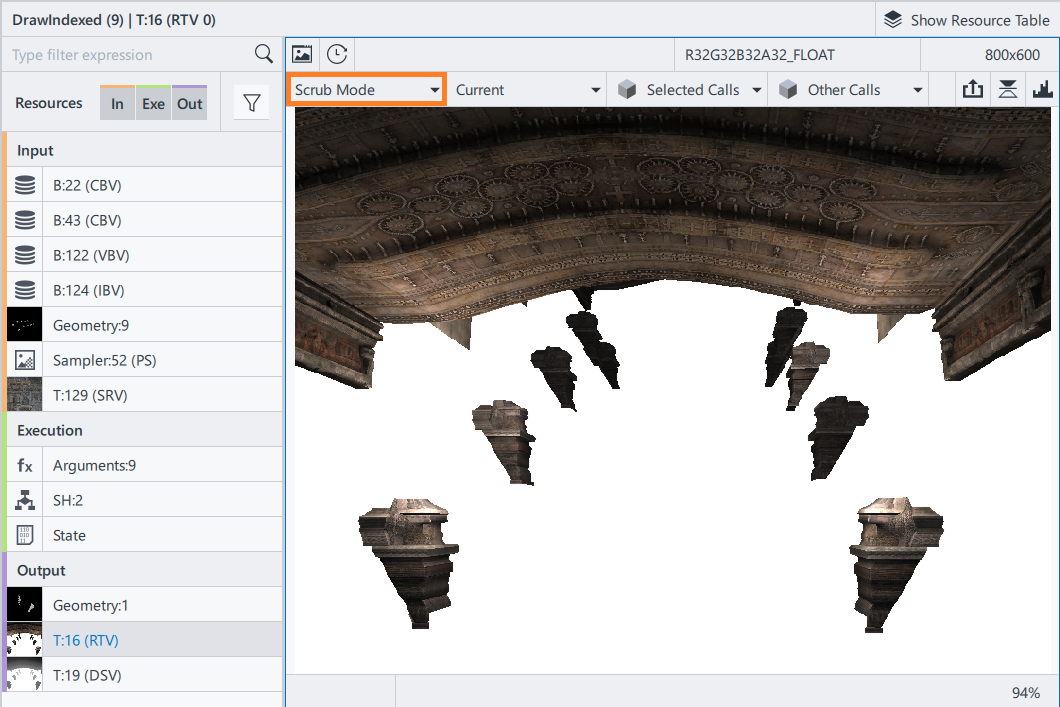
 Save Texture to File button - saves a texture image or render target in the Direct Draw Surface (DDS) format, Khronos Texture (KTX) format, or PNG format.
 Flip Image button - turns a texture image or render target upside down.
 Histogram button - opens a color histogram of a texture or render target.
 View toggle button - Switch between list and table views for the Buffer Viewer.
 Preset dropdown list - Select a preset.
 Apply button - Apply the Buffer Layout from the Layout Editor text editor.
 Revert button - Revert any modifications to the Buffer Layout and restore the saved state of the currently selected preset.