Visible to Intel only — GUID: nnm1684169786889
Ixiasoft
1. About This Document
2. Intel® Simics® Simulator and Virtual Platforms
3. Intel® Simics® Simulator for Intel® FPGAs Device Portfolio
4. Installing the Intel® Simics® Simulator for Intel® FPGAs
5. Getting Started with Intel® Simics® Simulator
6. Debugging Target Software
7. Networking with the Simulated Target System
8. Intel® Simics® Scripting
9. Software Debug Examples with Intel® Simics® Simulator
10. Document Revision History for Intel® Simics® Simulator for Intel FPGAs User Guide
A. Intel® Simics® Simulator Command Reference
5.3.1. Version of the Intel® Simics® Simulator for Intel FPGAs Software
5.3.2. Simulation Run Control from CLI
5.3.3. Intel® Simics® Simulator Command Scope
5.3.4. Intel® Simics® Simulator CLI Variables and Operations
5.3.5. Intel® Simics® Simulator CLI Command Completion and Command History
5.3.6. Intel® Simics® Command-Line Interface Help
5.3.7. Capture of CLI Session to a File
5.3.8. Intel® Simics® Simulator File Location and Intel® Simics® Search Path
Visible to Intel only — GUID: nnm1684169786889
Ixiasoft
9.1.2. Debugging a Linux Application with RiscFree* IDE
This section describes how to debug a Linux application using the RiscFree* debugger. The Linux application to debug is the same presented in Debugging a Linux Application with GDB. In this case, you also require having the symbols file of the application and the source code of the application so the debugger can access and perform the source code debug.
These are the items used for this debug example:
- TestSymFile.c: Source code of the Linux application.
- TestSymFile: Binary of the Linux application that must be executed from the Linux shell (ELF file). This was built to include the debug symbols embedded so this is also the symbols file.
- /home/simicsUser/SimicsInstallDir/SymDbg: Directory where the source code of the Linux application is located and also where the application binary is located.
The steps to perform the Linux application debug are shown in the following:
- Start a new RiscFree* session using an Intel® Simics® project directory in which the binaries allow us to boot to Linux. For the example used in this topic, reuse the projectRiscFree Intel® Simics® project from Starting a Simulation with Ashling* RiscFree* IDE.
- Launch a debug configuration as follows:
- Select Run > Debug Configurations menu or click the down arrow in the Debug icon:
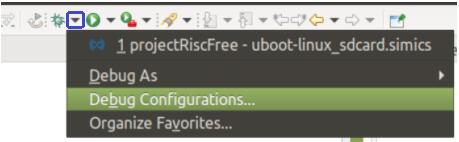
- Expand Intel® Simics® Session and double-click the debug configuration that you want to launch.
If you have no Intel® Simics® sessions to launch, create a new one as follows:
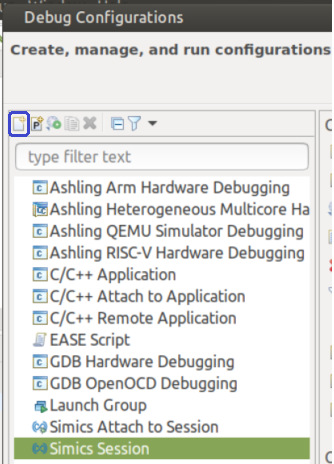
- In the Debug Configurations window, double-click Intel® Simics® Session. This creates a new debug configuration called New_configuration.
To create a new debug configuration, you can also select Intel® Simics® Session and click the New Launch Configuration icon:
- Edit the debug configuration as follows:
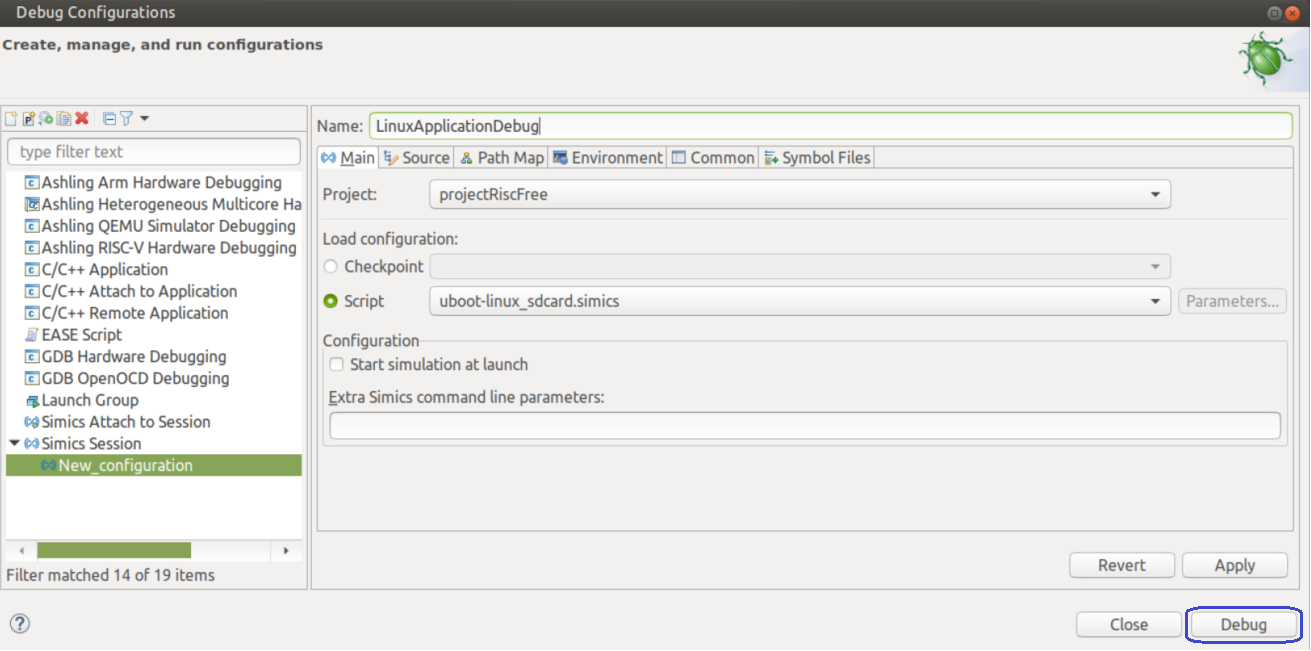
- Name your debug configuration LinuxApplicationDebug.
- In the Main tab, select Script and select your .simics target script that launches your simulation. In this example, you are launching uboot-linux_sdcard.simics. Ensure that the Start simulation at launch checkbox is cleared.
- In the Debug Configurations window, double-click Intel® Simics® Session. This creates a new debug configuration called New_configuration.
- Click Debug to launch the simulation and switch the RiscFree* IDE to the Debug perspective.
- Select Run > Debug Configurations menu or click the down arrow in the Debug icon:
- Load the debug symbols for the application by adding the following line to the target script where you can also setup all your debug configuration:
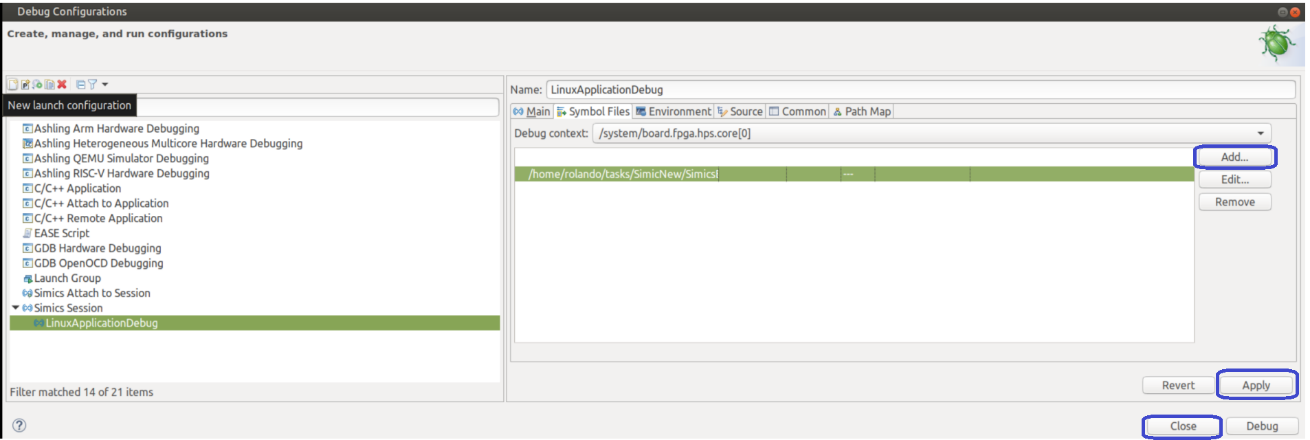
add-symbol-file "/home/simicsUser/SimicsInstallDir/SymDbg/TestSymFile"You can also load the debug symbols from the Symbols tab of the Debug Configuration. Select the core that runs the application from the Debug context field and click Add to add a path to the debug symbols file. Accept the default path to the symbols file.
If you are unsure about which core executes your Linux application, you can add the same symbol file to each core by changing the selected core in the Debug context field and clicking Add again.
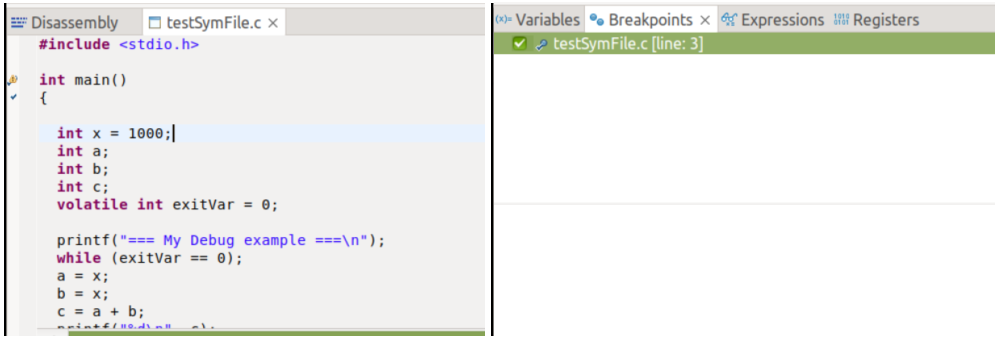
- Select File > Open File to open the test application source code file (TestSymFile.c) and set a breakpoint at the entry point of the main() function by double-clicking the line that display the function. The breakpoint is visible from the source code window and also from the Breakpoints window.
- Run the simulation by clicking Resume and waiting until the Linux prompt appears.
- Take the Linux application to the Linux kernel with the tftp command. To use tftp command, set the TFTP directory from the Service Node from the Intel® Simics® CLI:
#Intel Simics simulator CLI
running> service_node_cmp0.set-tftp-directory "/home/simicsUser/SimicsInstallDir/SymDbg"
# Linux shell
root@dhcp0:~# tftp -gr testSymFile 10.10.0.1
root@dhcp0:~# chmod +x testSymFile
root@dhcp0:~# ls
README intelFPGA testSymFile
- Run the Linux application and wait for the breakpoint at the entry point of the main() function.
# Linux shell
root@dhcp0:~# ./testSymFile
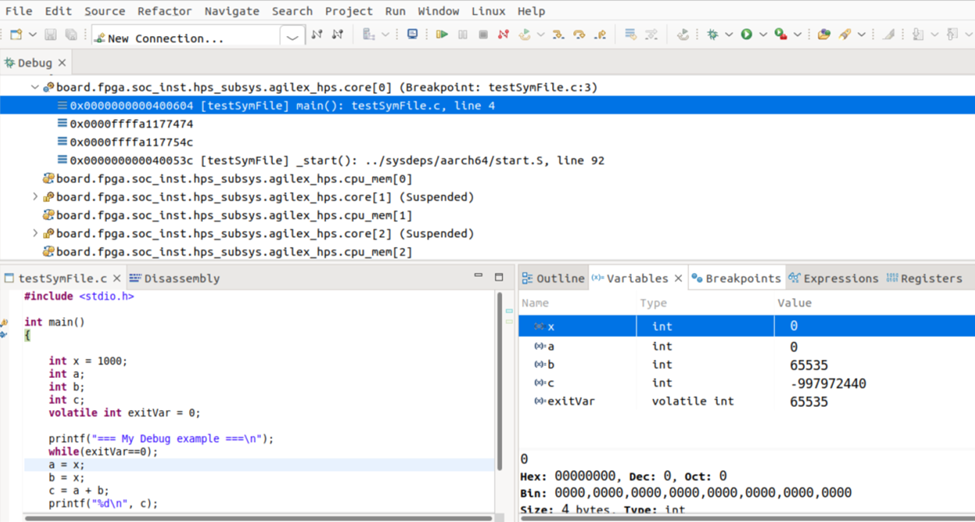
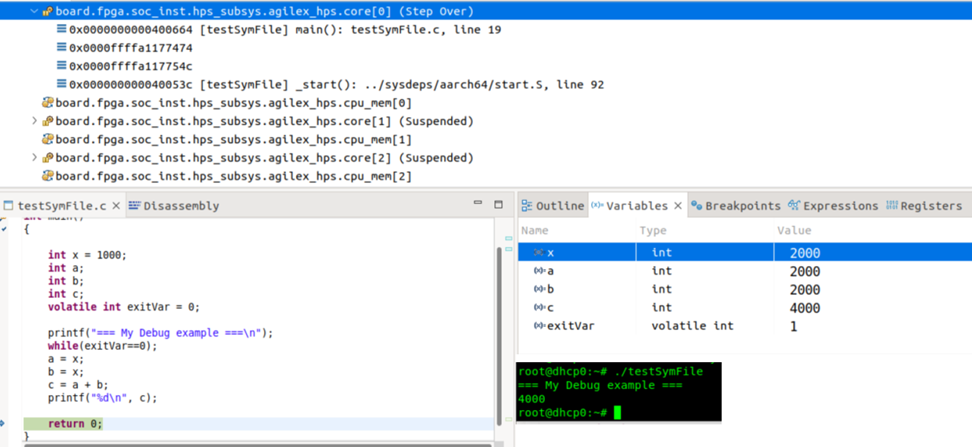
Observe that, after the breakpoint triggers, the Debug window shows the program counter of the CPU 0 in which the source code execution stopped. Also, the function, file and line number are shown.
The Source code window shows the current line in which the simulation stopped, and the Variables window shows the variables defined under this function including their types and current values. In this example, these variables have not been initialized yet.
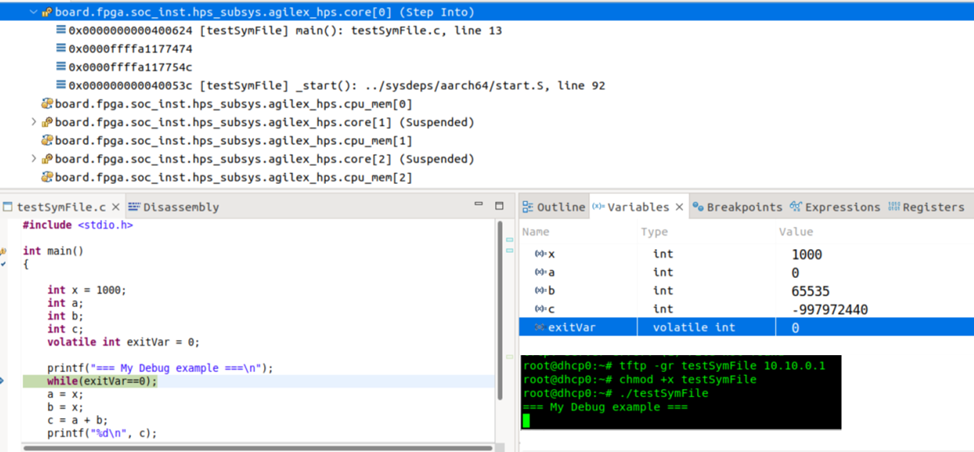
- Advance the simulation using the Step-over button until it reaches the while loop. The value of the exitVar variable is initialized to 0, so the code remains in the loop forever. Also observe that the variable x has also been initialized to 1000, while the a,b, and c variables were not initialized so they might have any value. In the serial console, the debug message is already shown.
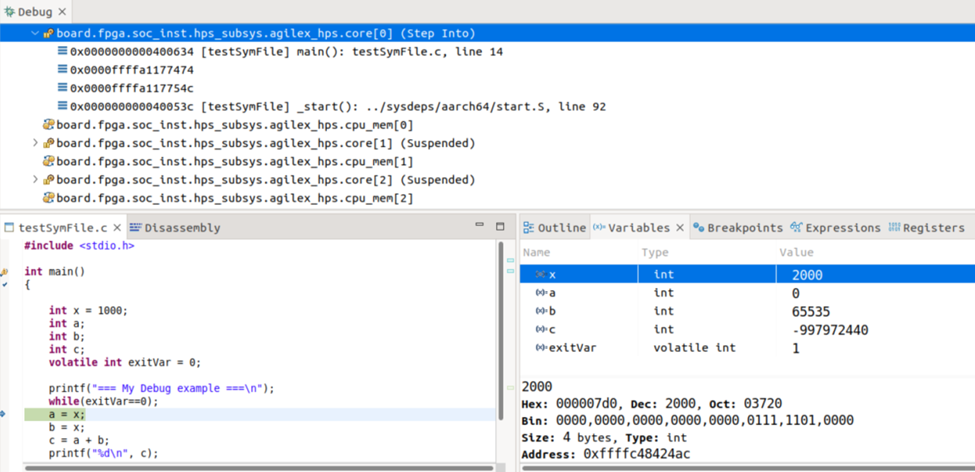
- Update the value of the exitVar variable to 1 so that the code execution leaves the while loop by clicking the variable value and entering a new value. Also, change the value of x variable to 2000, so you can modify the expected value from normal code execution. Click the Step-over button to observe that the code execution leaves the loop.
- Continue moving forward in the simulation using the Step-over button and observe how the variables are updated with the new value of x variable. The final value of the c variable is 4000. This value is printed in the serial console at the end of the execution of the Linux application.
The RiscFree* IDE also has an Expressions window where you can define expressions using the variables defined in the source code and evaluate them.
In the example that follows, observe the value of adding a, b, and c variables, or check if the current value of c is 4000 as expected.
With this example, the following features were demonstrated:
- Create a debug configuration. You can launch this debug configuration later in other simulations to speed up the debug process.
- Load symbol files and observe how the simulation advances in the execution of the source code.
- Set breakpoints in the source code.
- Control code execution using the Step-over button.
- Observe the current value of the variables in the source code and update their values.
- Observe and evaluate expressions related to the source code.