Developing a Visual Studio Code* Project for SSH Development on Windows Subsystem for Linux*
Using Visual Studio Code* with Intel® oneAPI Toolkits
This guide assumes you are familiar with C/C++ development and the Visual Studio Code (VS Code) editor. If you are new to Visual Studio Code, review these VS Code documentation links:
The following procedure will use a Remote Host connection enabling you to edit and debug your code using the Windows Subsystem for Linux* (WSL).
Prerequisites
Visual Studio Code for Linux
A Linux distribution running on WSL with the Intel® oneAPI Base Toolkit (Base Kit) installed.
Set oneAPI Environment Variables on the WSL Target Linux
In order to perform development on your remote WSL target, you must install (at minimum) the Intel® oneAPI Base Toolkit (Base Kit) and configure the oneAPI development environment variables on the WSL target Linux. The recommended installation method is Installing via Linux* Package Managers.
Open a WSL terminal and install the Base Kit on to that target Linux system using the appropriate Linux package manager.
NOTE:To get started, you need to install only the Base Kit on your WSL target; you can install additional Intel® oneAPI Toolkits either now or at a later time.Configure your WSL Linux target so that the oneAPI development environment script (setvars.sh) runs when VS Code initiates a connection.
NOTE:Visual Studio Code does not currently provide a mechanism to automatically run scripts on your remote Linux target when it interacts with the WSL system (for example, running setvars.sh automatically). There are a variety of ways to get around this issue, only one of which is presented here. See the Bash Startup Files man page for more options.
Add the following shell script lines to your remote Linux system’s /etc/profile script. This location (or in an /etc/profile.d/ script) will ensure that all users of your WSL target development system will run the setvars.sh environment script when they connect using Visual Studio Code:
The above assumes that you have installed your Intel® oneAPI Toolkits on the WSL system in the default “root/sudo” installation location (/opt/intel/oneapi/). If you have installed the oneAPI tools in a different location on your remote Linux system, you will have to adjust the path to setvars.sh.
Configure Visual Studio Code on Your Local Host
You must install the VS Code “Remote - WSL” extension into your local copy of VS Code. This extension facilitates development on the WSL* system.
Install the Remote - WSL extension by Microsoft. Click the Extensions icon and search for “remote wsl” in the search bar.
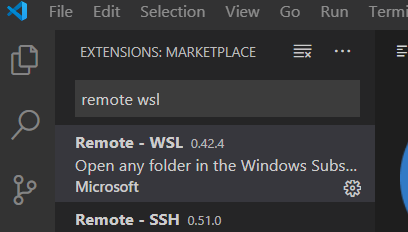
Click install. After installation, you see Remote – WSL in the Installed Extensions list.
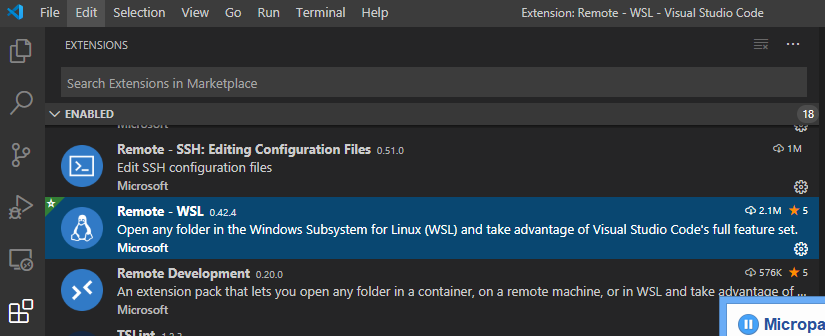
Connect to Your WSL Linux System
See the Visual Studio Code Remote Development in WSL documentation for detailed instructions, requirements, and additional information.
Open a WSL terminal for your desired Linux distribution. From within the terminal, invoke VS Code from the command line to start a local instance connected to WSL.
A new VS Code window opens and is connected to the WSL system.
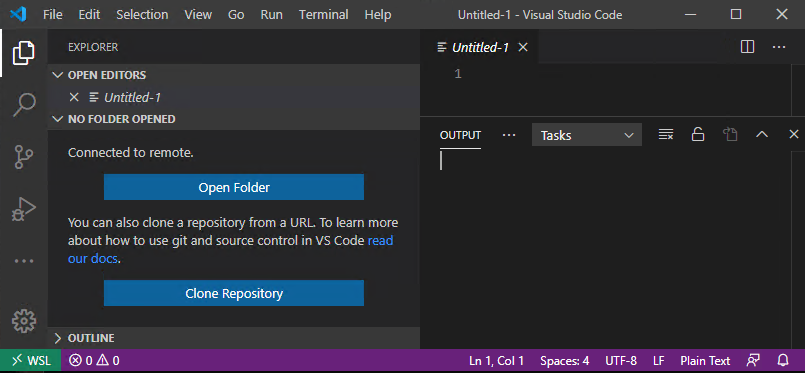
Once connected, add the C/C++ extension to the VS Code instance. This extension is required to debug a remote session using the VS Code debug interface.
Explore Samples Using Visual Studio Code*
Before working with oneAPI samples, it is recommended that you install the VS Code “Sample Browser for Intel oneAPI Toolkits” extension and the VS Code “Environment Configurator for Intel® Software Development Tools” extension.
Both can be quickly found in the VS Code extensions marketplace by typing “oneapi” into the marketplace search bar.
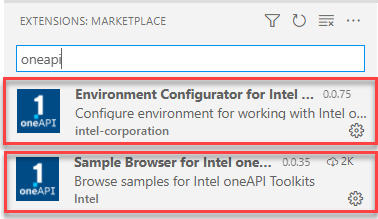
The steps below describe how to use these extensions to configure the oneAPI development environment for use with VS Code and use the Sample Browser to locate and create sample projects that help you learn how to use oneAPI features.
To configure the oneAPI environment in VS Code:
PressCtrl+Shift+P ( or View -> Command Palette… ) to open the Command Palette.
Type Intel oneAPI to view options of the installed extensions.
Click on Intel oneAPI: Initialize environment variables.
Locate the setvars | oneapi-vars file:
Linux: By default in the Component Directory Layout, setvars.sh is located in /opt/intel/oneapi/ for root or sudo installations, or located in ~/intel/oneapi/ for local user installations.
Linux: By default in the Unified Directory Layout, oneapi-vars.sh is located in /opt/intel/oneapi/<toolkit-version>/ for root or sudo installations, or located in ~/intel/oneapi/ for local user installations.
Windows: By default in the Component Directory Layout, setvars.bat is located in C:\Program Files(x86)\Intel\oneAPI\
Windows: By default in the Unified Directory Layout, oneapi-vars.bat is located in C:\Program Files(x86)\Intel\oneAPI\<toolkit-version>\
If you customized the installation folder, setvars | oneapi-vars is in your custom folder.
In the case of multiple folders in workspace, select the appropriate one. All tasks, launches, and terminals created from VS Code will now contain the oneAPI environment.
To browse oneAPI samples using VS Code:
Click on the oneAPI button on the left navigation to view samples. If you do not have the extension installed, search the Extensions Marketplace for “Sample Browser for Intel oneAPI”.

A list of available samples will open in the left navigation.
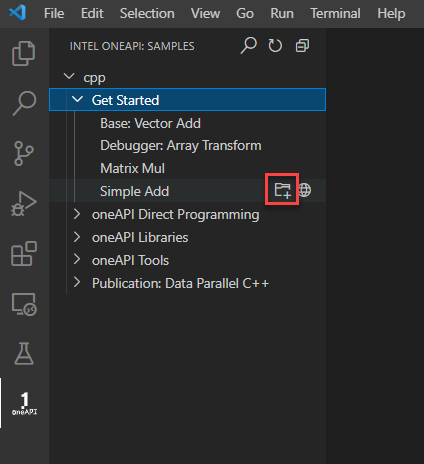
To view the readme for the sample, click the
 next to the sample. If you choose to build and run the sample, the readme will also be downloaded with the sample.
To build and run a sample, click the
 to the right of the sample name.
Create a new folder for the sample. The sample will load in a new window:
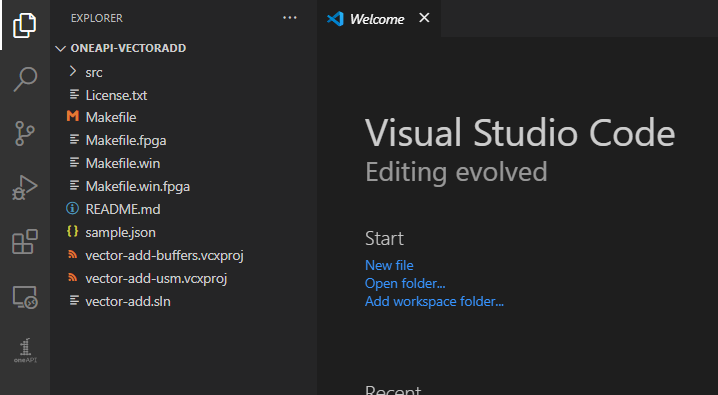
Click README.md to view instructions for the sample.
Try Debugging (CPU and GPU Only)
The GDB with GPU Debug Support for Intel® oneAPI Toolkits extension for Visual Studio Code (VS Code) enables additional features of GPU debugging with GDB for Intel® oneAPI toolkits. Note that this feature is only available for the Linux* target platform. Start using this VS Code extension with guide Get Started with Intel® Distribution for GDB* on Linux* OS Host. <https://www.intel.com/content/www/us/en/docs/distribution-for-gdb/get-started-guide-linux/2024-0/overview.html>`__
This section assumes that you can build your sample and have installed the Microsoft VS Code C/C++ Extension. The C/C++ extension is required to configure the oneAPI C/C++ debugger.
The Intel® oneAPI Base Toolkit includes a special version of GNU* GDB (gdb-oneapi) designed to support oneAPI C/C++ applications. To debug your DPC++ application using this special debugger, you will need to make changes to the .vscode/launch.json configuration file.
Go to Debug > Open Configurations, and open the launch.json configuration settings.
NOTE:If you are prompted to select a debug environment, choose C++ (GDB/LLDB).
Copy the code shown below into your launch.json file, and replace the "program": property’s value with the path to your project’s executable (that is, the application that you are going to debug).
NOTE:If VS Code doesn’t recognize the application name, you may have to insert the full path and file name into the launch.json file’s "program": property.Add gdb-oneapi to your launch.json configuration’s "miDebuggerPath": property.
NOTE:The gdb-oneapi application should have been added to your path when you ran setvars.sh | oneapi-vars.sh to configure the oneAPI development environment, prior to starting VS Code. If you prefer, you can specify the full path and filename to the gdb-oneapi application in your launch.json file.In some configurations, GDB may not be compatible with VS Code. If this happens, add the environment variable to disable `gdb-oneapi` support for GPU autolaunch. This can either be done in the environment prior to launching VS Code, or within the launch.json: export INTELGT_AUTO_ATTACH_DISABLE=1
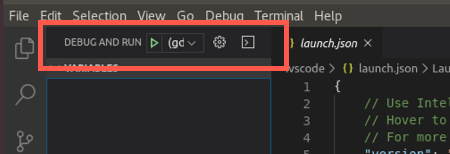
Bring up the debug view by selecting the Run icon in the Activity Bar. You can also use the keyboard shortcut (Ctrl+Shift+D).

Start the run and debug session by clicking the green DEBUG AND RUN icon, or go to Run > Start Debugging (F5).
