A newer version of this document is available. Customers should click here to go to the newest version.
Visible to Intel only — GUID: GUID-792BEE47-8F92-4F4A-A8FB-243BEF21E916
Visible to Intel only — GUID: GUID-792BEE47-8F92-4F4A-A8FB-243BEF21E916
Intel® Profiling Tools Interfaces for GPU
Intel® Intercept Layer for OpenCL Applications is limited to OpenCL backend. To trace applications using Level Zero and/or OpenCL backend, you need Intel® Profiling Tools Interfaces for GPU.
Intel® Profiling Tools Interfaces for GPU is a collection of code samples and documentations for developers who are interested in building their own tools. It also has a set of tools for developers who prefer lightweight command-line performance tools and onetrace is one of them.
Like Intel® Intercept Layer for OpenCL Applications, onetrace traces activities on both the host and/or the device while the application is running.
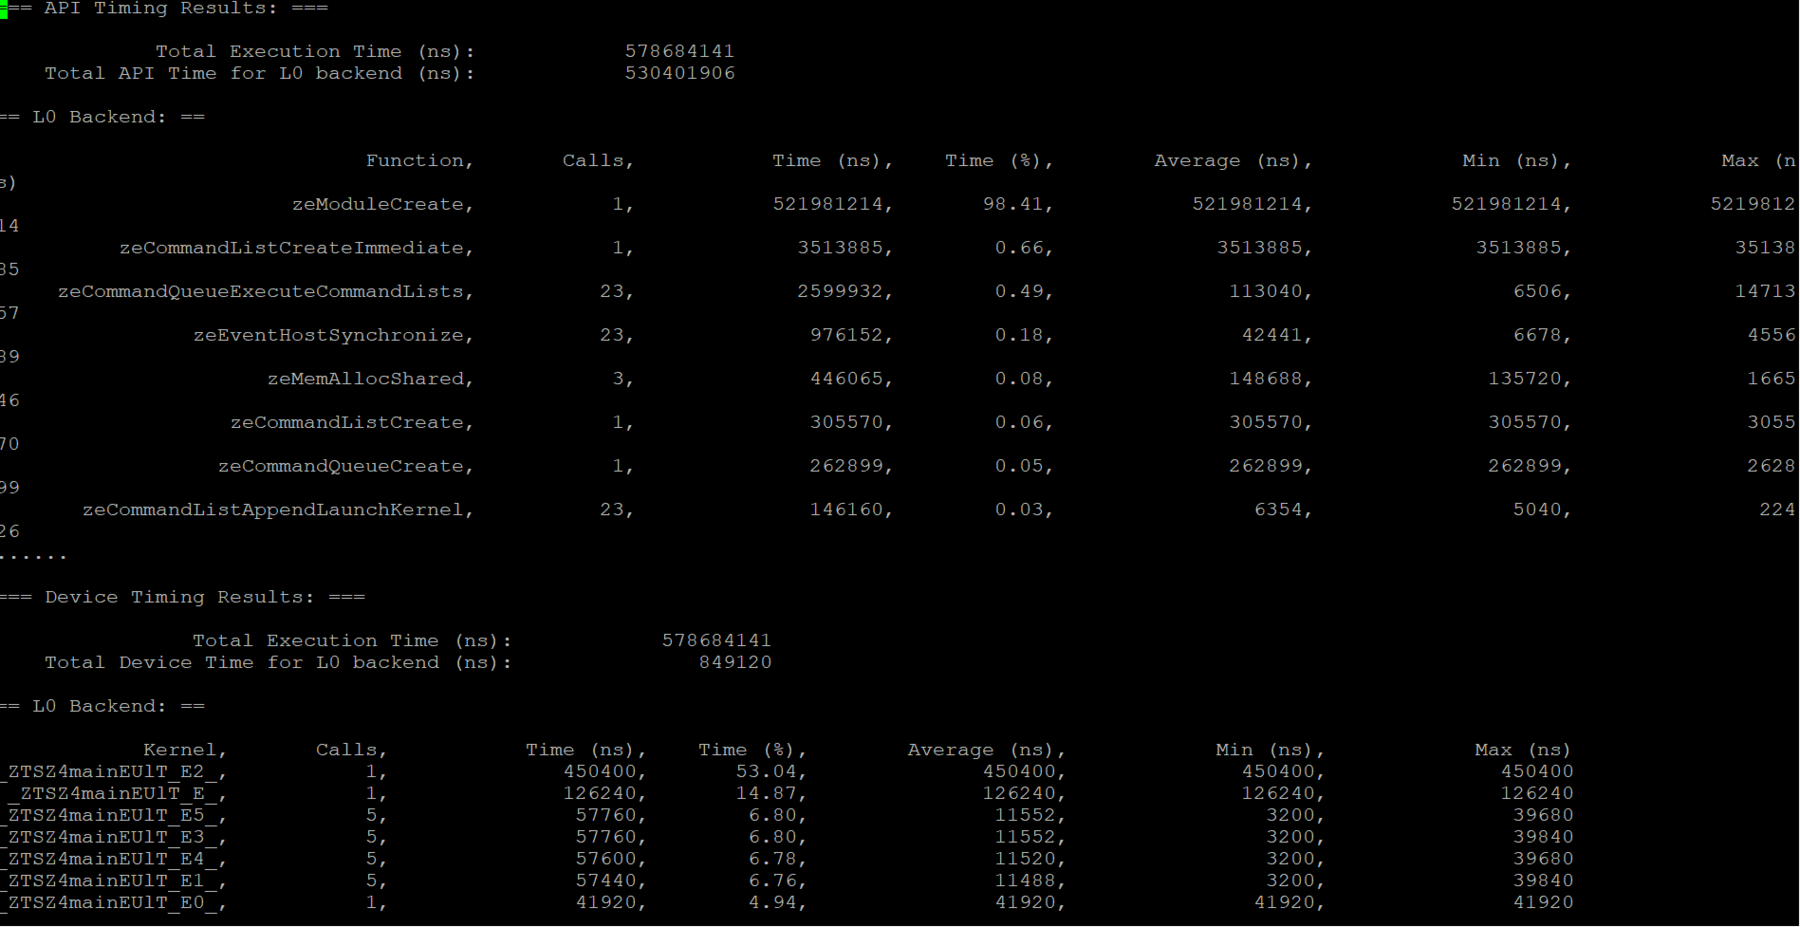
By default, onetrace times kernels and/or commands executed on the device and Level Zero and/or OpenCL calls on the host:
onetrace <application>
You can also use onetrace to collect host/device/kernel timeline data and use chrome://tracing to view the timelines:
onetrace --chrome-call-logging --chrome-device-timeline <application>

More information on onetrace and other tools including source code is available in the Intel® Profiling Tools Interfaces for GPU repository.