A newer version of this document is available. Customers should click here to go to the newest version.
Visible to Intel only — GUID: GUID-8BBC4956-9C95-4965-B87B-8DFDC9D1F39A
Visible to Intel only — GUID: GUID-8BBC4956-9C95-4965-B87B-8DFDC9D1F39A
Hardware-assisted Stall Sampling
In Intel VTune Profiler, GPU Offload analysis can be used to find out offload efficiency and GPU Compute/Media Hotspots analysis covers the execution efficiency on GPU. The characterization of GPU execution efficiency is partly addressed by VTune Profiler GPU Compute/Media Hotspots Characterization mode in the previous section. Except for the Dynamic Instruction Count option, the Characterization mode is hardware counter based and its granularity is a compute kernel. While it allows estimation of execution efficiency at kernel level (e.g., Active/Stalled/Idle metric), the Characterization mode provides limited performance insights at source/assembly level. As a result, performance optimization for medium or large kernels could become a time-consuming task, based on assumptions and guesswork, with multiple iterations of source-level changes that help address inefficiencies observed at the kernel or application level. Source Analysis mode in GPU Compute/Media Hotspot analysis can be a good next step after Characterization mode to look closer at time consuming kernels and pinpoint source lines or instructions which take a significant amount of time, including Basic Block and Memory latency analysis and HW-assisted stall sampling.
HW-assisted stall sampling is a new performance monitoring capability implemented in Intel® Data Center GPU Max Series, which statistically correlates Xe-Vector Engine (XVE) stall events to the executed instructions and breaks down the stall events by different stall reasons. In this sampling mechanism, XVEs are sampled based on a fixed, configurable number of cycles that have been checked for stalls. An XVE is considered to be stalled, if and only if, there is at least one thread loaded, but no thread can execute in the sampled cycle. If there is an XVE stall, a representative thread out of the hardware threads is selected based on a proprietary heuristic, and the Instruction Pointer of the selected thread is recorded along with the cause for the stall. An XVE can stall due to several reasons such as on an instruction fetch, send operation on a barrier, etc. In Intel® Data Center GPU Max Series, XVE stall sampling provides eight counters which count stalls due to eight different reasons as shown in Table 3. With the most fine-grain interval, HW-assisted stall sampling is expected to have an overhead of ~10% of kernel/application execution.
HW Stall Reason |
Description |
|---|---|
ACTIVE |
Actively executing in at least one pipeline |
INST_FETCH |
Stalled due to an instruction fetch operation |
SYNC |
Stalled due to sync operation |
SCOREBOARD ID |
Stalled due to memory dependency or internal XVE pipeline dependency |
DIST or ACC |
Stalled due to internal pipeline dependency |
SEND |
Stalled due to memory dependency or internal pipeline dependency for send |
PIPESTALL |
Stalled due to XVE pipeline |
CONTROL |
Stalled due to branch |
OTHER |
Stalled due to any other reason |
Configuring and Running in GUI
Set the environment variable (AMPLXE_EXPERIMENTAL=gpu-stall-sampling)*
Launch VTune Profiler and click New Project from the Welcome page.
Create a Project dialog box opens.
Specify a project name and a location for your project and click Create Project.
The Configure Analysis window opens.
Make sure the Local Host is selected in the WHERE pane.
In the WHAT pane, make sure the Launch Application target is selected and specify application name and parameters in the correspondent fields.
In the HOW pane, select GPU Compute/Media Hotspots analysis type from the Accelerators group.
Make sure that Source Analysis mode is selected on the GPU Compute/Media Hotspots analysis configuration pane. Choose “Stall Sampling” option from drop box correspondent to Source Analysis mode.
Configuring and Running in CLI
Set environment by sourcing the script:
source <vtune_install_dir>/env/vars.sh
Set the environmental variable since stall sampling is still an experimental feature:
export AMPLXE_EXPERIMENTAL=gpu-stall-sampling
Run the analysis command:
vtune -collect gpu-hotspots -knob profiling-mode=source-analysis -knob source-analysis=stall-sampling -- <app> [parameters]
Visualizing Data
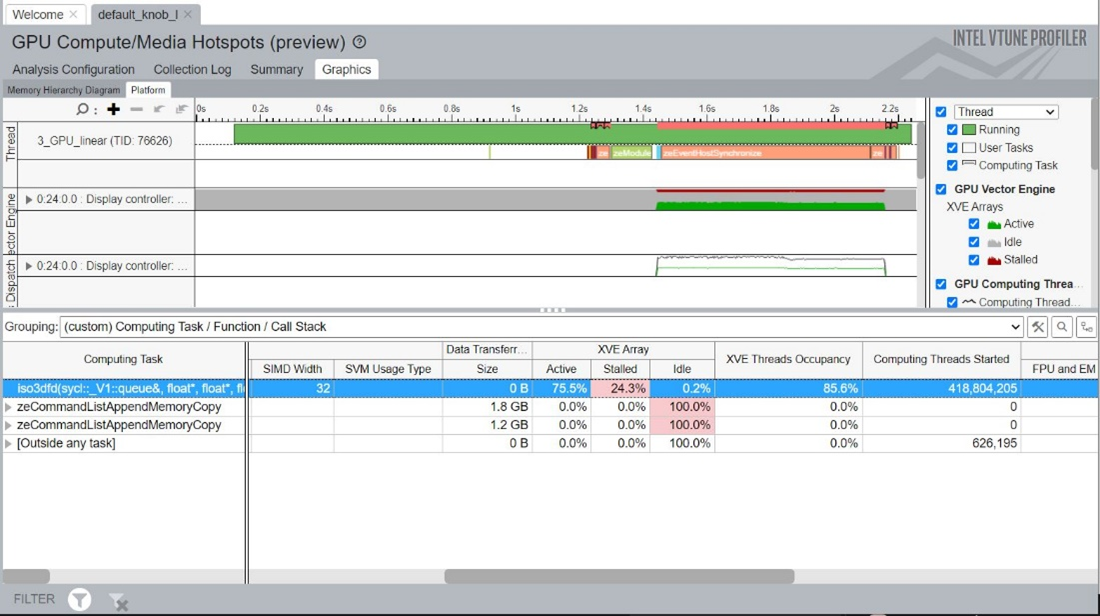
The use case of iso3dfd (linear indexing version) from oneAPI sample (https://github.com/oneapi-src/oneAPI-samples/tree/master/DirectProgramming/C%2B%2BSYCL/StructuredGrids/guided_iso3dfd_GPUOptimization) is used to illustrate how to visualize the data from HW-assisted Stall Sampling analysis. In this example, the Characterization mode of GPU Compute/Media Hotspots shows that about a quarter of the GPU time is spent in stalls during the application execution. Stall Sampling is followed to identify where and why the application is stalled and gain insights to the behavior of the code at an instruction level.
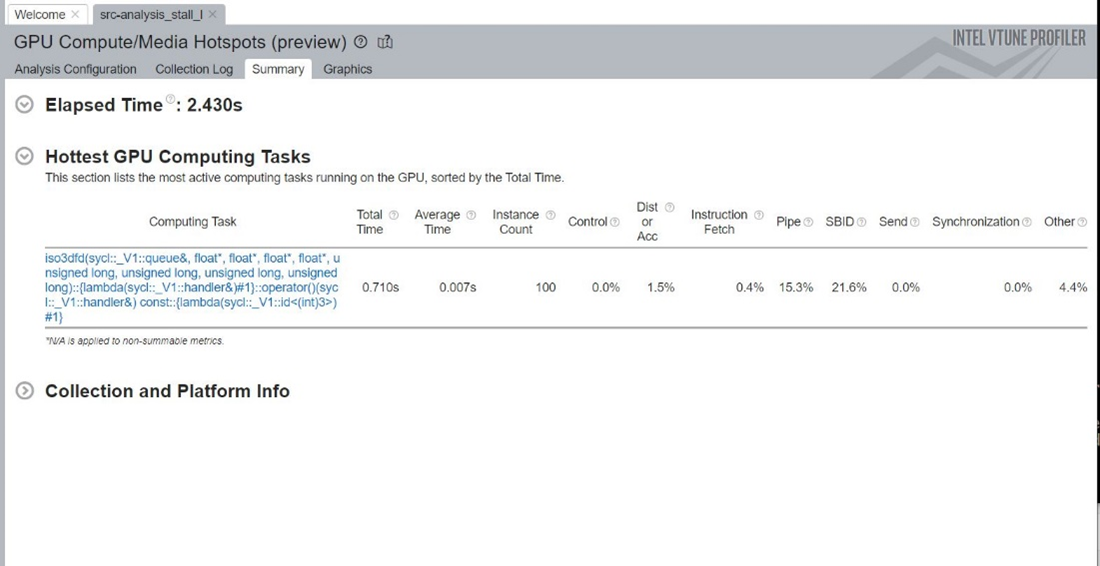
The main views which are exploited by HW-Stall Sampling are the Summary and Graphics tabs. In the Summary tab, the most time-consuming GPU tasks are displayed along with their associated percentage breakdown of each stall reason. In our example, the two main reasons for stall in the hottest computing task are Pipestall and Scoreboard ID.
The Graphics tab shows a grid with compute tasks (kernels) and are active and stalled by reason sample count or percent from samples for each compute kernel aggregated by all instances. The grid grouping GPU Adapter/GPU Stack/Compute Task/Function/Call Stack expands a kernel row to see statistics by functions and GPU call stacks at GPU Stack (Tile) and Card levels.
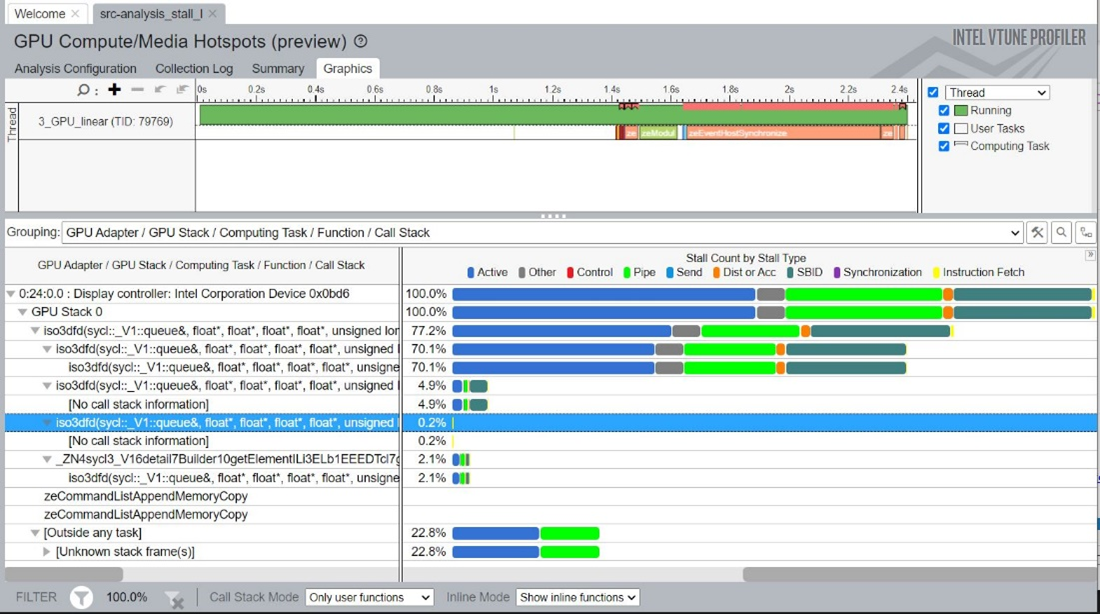
It is also possible to expand Stall Count by Stall Type column to have a breakdown by stall type in the columns to see precise numbers and do sorting for a specific reason.
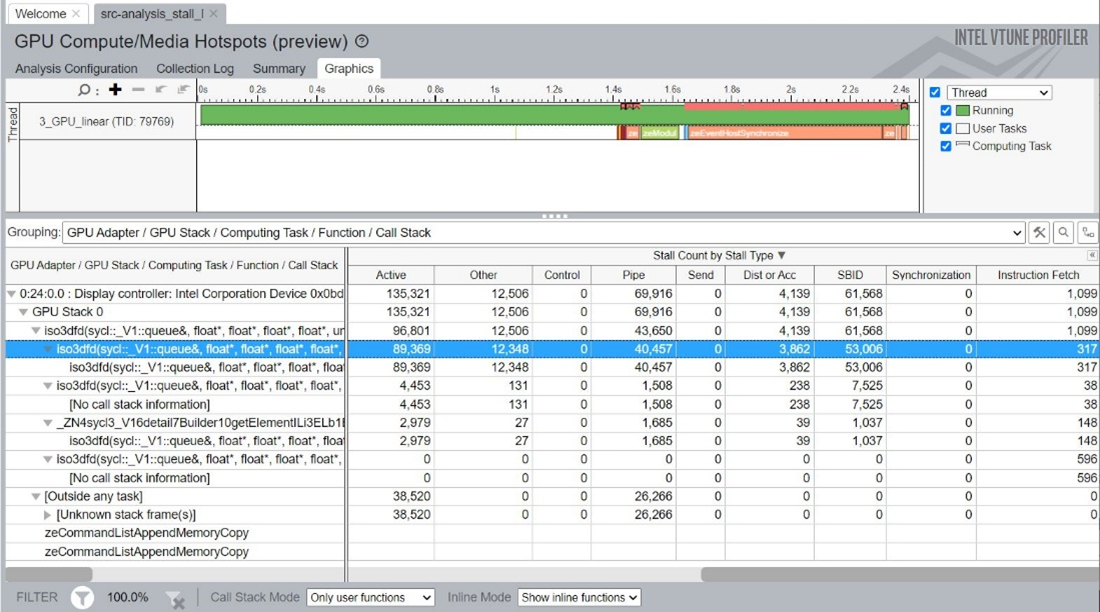
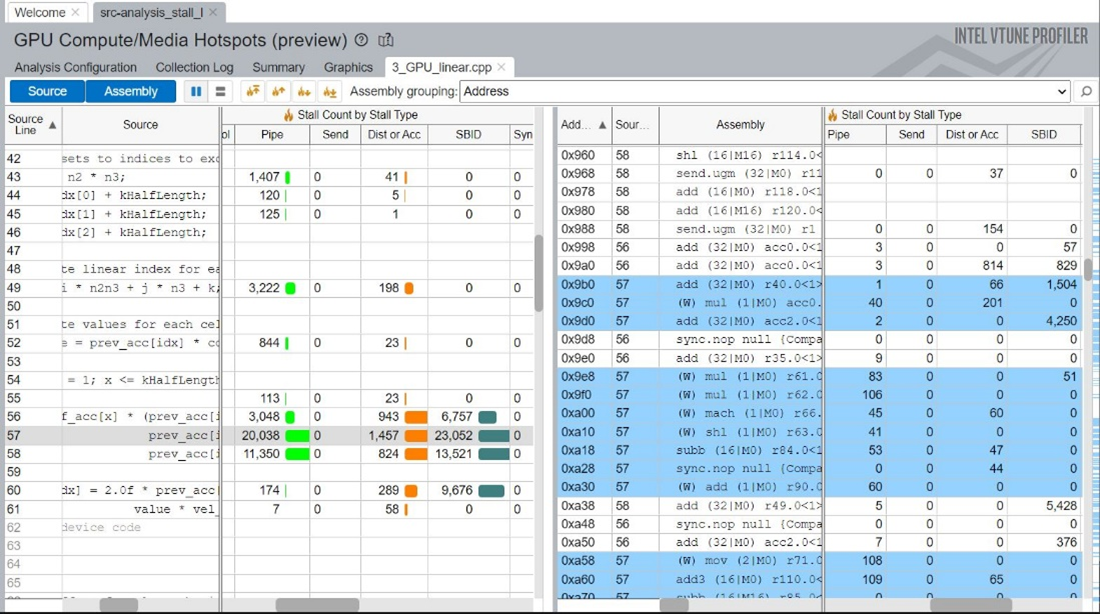
To see active or stalled samples distributed by source/assembly, go to Source View by double-clicking on a compute task or function of interest.
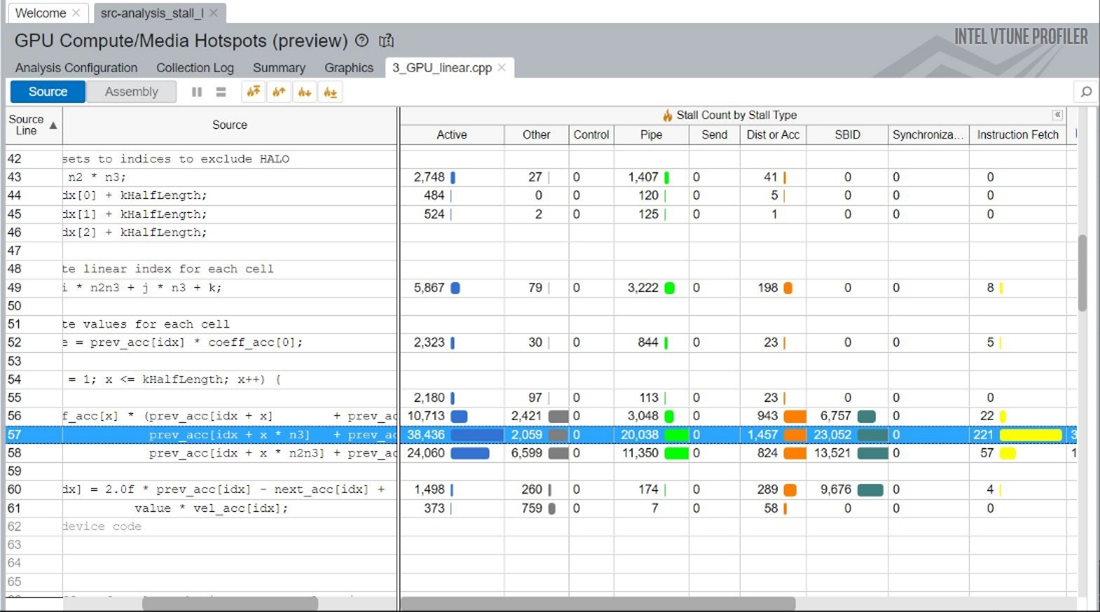
To see Assembly View or Source/Assembly side-by-side, use the “Assembly“ toggle button. It is worth to note that Source and Assembly pane are synchronized on a row selection.
